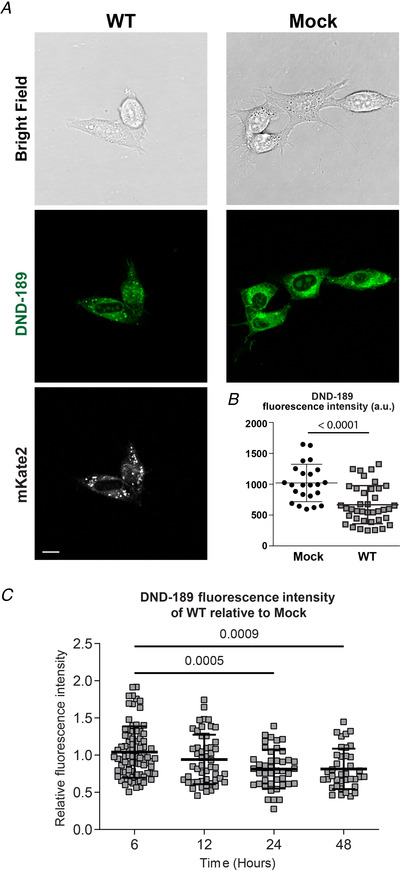
Figure 3. SARS‐CoV‐2 E protein expression decreases DND‐189 fluorescence in NIH 3T3 cells.

A, representative cell images of NIH 3T3 cells transfected with pcDNA3 vector (Mock) or WT. Top row, bright‐field images; second row, LysoSensor DND‐189 images (green fluorescence); third row, mKate2 fluorescence to confirm E protein expression. Scale bar, 10 μm. B, quantification of fluorescence intensity in mock (n = 23) and WT (n = 39) transfected cells showing a decrease in mean cell fluorescence intensity 24 h following WT expression (1021 ± 304 vs. 668 ± 308 a.u. for mock and WT, respectively), which is consistent with an increase in luminal pH within organelles. Fluorescence was quantified using ImageJ analysis software. Student's t‐test, P < 0.0001. C, the time course of changes in pH monitored via fluorescence intensity at 6, 12, 24 and 48 h post‐transfection (n = 83, 51, 43 and 38, respectively) showing a decreasing relative fluorescence intensity (r.f.u., relative to mock) over time, indicating an increase in organellar pH. One‐way ANOVA F (3,211) = 7.133, P = 0.0001, Bonferroni's post hoc test when compared to 6 h (1.04 ± 0.34 r.f.u.): 12 h (0.94 ± 0.33 r.f.u., P = 0.2022), 24 h (0.81 ± 0.26 r.f.u., P = 0.0005), 48 h (0.81 ± 0.27 r.f.u., P = 0.0009). In B and C, data were collected and pooled from three separate transfections for each condition. Data are presented as means ± SD. [Color figure can be viewed at wileyonlinelibrary.com]
