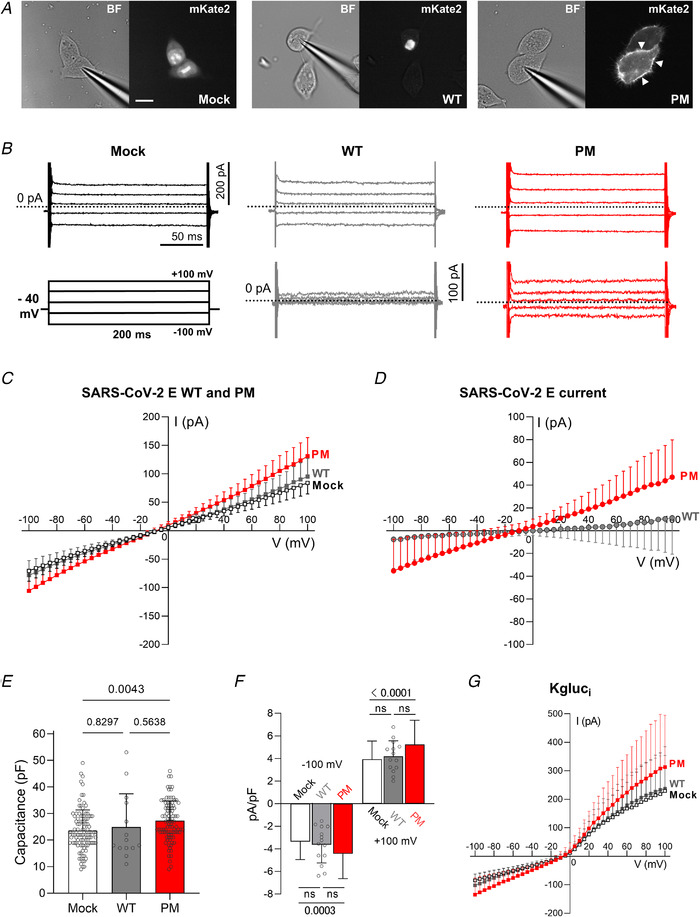
Figure 4. Membrane currents from HEK 293S cells expressing SARS‐CoV‐2 E WT or PM constructs.

A, representative images of HEK 293S cells transfected with mock (NLS‐mKate2 into pcDNA3), WT and PM SARS‐CoV‐2 E protein constructs. Left panels, bright field images; right panels, mKate2 fluorescence. Scale bar, 20 μm. B, representative current records from HEK 293S cells expressing pcDNA3 vector (mock), WT and PM in top panels, and ‘mock subtracted’ traces of WT and PM in the bottom panels. Scale bars: 200 pA (vertical), 50 ms (horizontal). ‘Mock subtracted’ records are shown below. Scale bar, 100 pA. Dotted lines indicate zero current level. C, averaged I–V curves of mock (open squares, n = 102 from 24 transfections), PM (n = 95 from 22 transfections) and WT (n = 14 from 3 transfections) transfected cells. There was no difference between WT and mock (two‐way ANOVA, main difference between constructs, F (2,208) = 13.69, P < 0.0001, with Tukey's post hoc test, P = 0.7036 for WT vs. mock). When PM was expressed in HEK 293S cells, we observed higher total membrane conductance than with WT or mock (two‐way ANOVA, F (2,208) = 13.69, P < 0.0001, Tukey's post hoc: P < 0.0001 for PM vs. WT, and P < 0.0001 for PM vs. mock). D, subtracting mock‐transfected cell data from WT‐transfected data reveals no current. A larger voltage‐independent current is recorded in cells transfected with PM, and is revealed by digital subtraction (‘mock subtraction’) (two‐way ANOVA, main difference between constructs, F (1,107) = 3.334, P = 0.0742, and Bonferroni's post hoc test: P < 0.05 for V < −70 mV and >45 mV, P < 0.0001 at −100 mV and +100 mV). E, capacitance of PM (n = 95), mock (n = 102) and WT (n = 14) HEK 293S transfected cells (one‐way ANOVA, F (2,208) = 5.192, P = 0.0063, and Tukey's post hoc test: Mock vs. PM, P = 0.0043; Mock vs. WT, P = 0.8297; and PM vs. WT, P = 0.5638). F, current amplitudes in B were normalized to yield current density (pA/pF). Compared to mock‐transfected cells, the normalized current density of PM was greater at −100 mV (one‐way ANOVA, F (2,208) = 8.03, P = 0.0004, Tukey's post hoc test, Mock: −3.37 ± 1.58 pA pF−1 vs. PM: −4.44 ± 2.20 pA pF−1, P = 0.0003) and at +100 mV (one‐way ANOVA, F (2,208) = 12.35, P < 0.0001, Tukey's post hoc test, Mock: 3.93 ± 1.61 pA pF−1 vs. PM: 5.24 ± 2.15 pA pF−1, P < 0.0001). Current densities for WT were −3.64 ± 1.62 pA pF−1 at −100 mV (P = 0.3005, WT vs. PM) and 4.18 ± 1.38 pA pF−1 at +100 mV (P = 0.1227, WT vs. PM). No differences were found between Mock and WT (Tukey's post hoc test, at −100 mV: P = 0.8714, and at +100 mV: P = 0.8796). For visualization purposes, ns: not significant. G, using the whole‐cell configuration of the patch‐clamp technique with potassium gluconate in the pipette (Kgluci), cells transfected with the pcDNA3 vector only (mock, open squares, n = 13), WT (n = 7) and PM (n = 12) all exhibit a voltage‐dependent outward current. I–V relationships with potassium gluconate reveal a larger current in PM compared to mock‐transfected HEK 293S cells (mixed‐model two‐way ANOVA, main difference between constructs, F (2,29) = 0.3026, P = 0.011, and Tukey's post hoc test, PM vs. mock, P < 0.05 at V > +80 mV). The values plotted in the graphs are expressed as means ± SD. Currents in B–D and G were elicited by 200 ms commands from V h = −40 mV in 5 mV steps (from −100 mV to + 100 mV). [Color figure can be viewed at wileyonlinelibrary.com]
