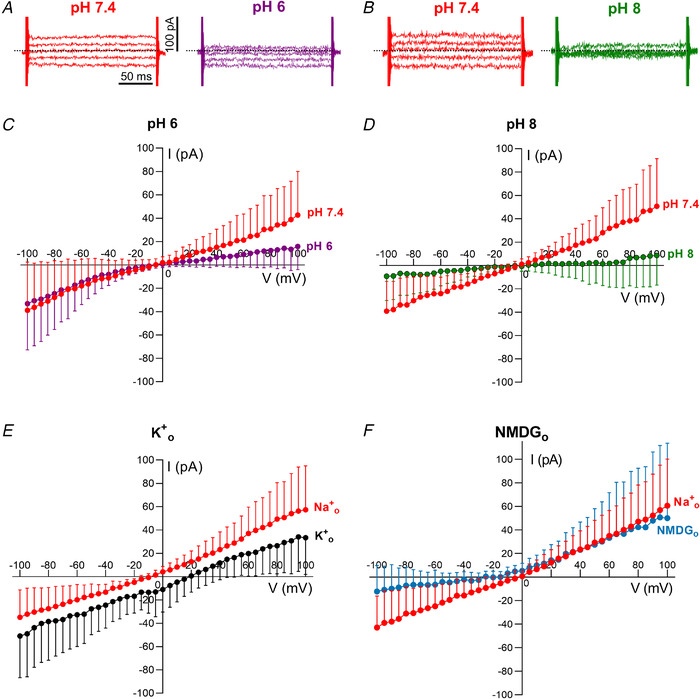
Figure 5. The E protein is modulated by pH and is permeable to small cations.

A and B, representative examples of mock‐subtracted traces in standard Na+ extracellular solution at pH 7.4 (A and B) and after exchange with a similar external solution at pH 6 (A) or pH 8 (B). Dotted lines indicate the zero current level. Scale bars: 100 pA (vertical), 50 ms (horizontal). C–F, averaged mock‐subtracted current–voltage relationships for whole‐cell current in PM‐transfected cells in response to changes of pH and ion substitution in the external solution. Currents were elicited by 200 ms commands from V h = −40 mV in 5 mV steps (from −100 mV to +100 mV). C, the mock‐subtracted SARS‐CoV‐2 E current is linear at pH 7.4 but shows inward rectification when the external solution is exchanged for one at pH 6 (Mock = 11, PM = 12, from 5–6 transfections; two‐way ANOVA, main effect of pH: F (1,11) = 4.079, P = 0.0667, Bonferroni's post hoc test, P < 0.05 at V >75 mV, P < 0.0001 at +100 mV). D, SARS‐CoV‐2 E current measured at pH 7.4 is reduced when exposed to an external solution at pH 8 (Mock = 9, PM = 8, from 4–5 transfections; two‐way ANOVA, main effect of pH: F (1,7) = 6.628, P = 0.0368, Bonferroni's post hoc test, P < 0.05 at V h < −85 mV (P = 0.0017 at −100 mV) and V h > +60 mV (P < 0.0001 at +100 mV)). E, the SARS‐CoV‐2 E protein is permeable to K+. The standard external solution containing Na+ was replaced by a high K+ solution and the E rev shifted from −8.5 mV (95% CI: −11.7, −5.5 mV) in Na+ o to 18.7 mV (17.2, 20.3 mV) in high K+ o (Mock = 10, PM = 11, from 4–5 transfections; two‐way ANOVA, main effect of K+, F (1,10) = 20.85, P = 0.0010). The relative permeability ratio P K: P Na was estimated as 2.9 (2.8, 3.2). F, SARS‐CoV‐2 E protein is not permeable to NMDG (Mock = 11, PM = 10, from 4–5 transfections; two‐way ANOVA, main effect of NMDG: F (1,9) = 14.26, P = 0.0044, Bonferroni's post hoc test, P < 0.05 at V h < −85 mV (P = 0.0032 at −100 mV)). The relative permeability ratio of P Na: P Cs was estimated as 0.9 (0.7, 1.0). The values plotted in the graphs are expressed as means ± sd. [Color figure can be viewed at wileyonlinelibrary.com]
