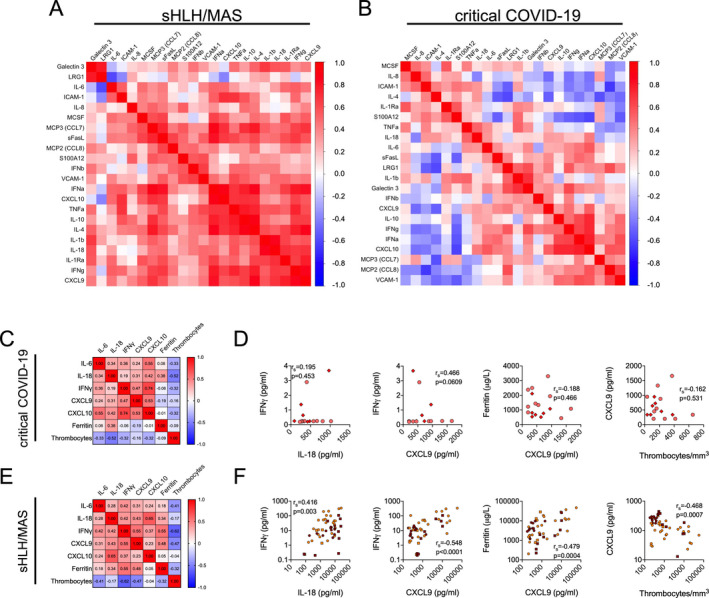
Figure 2.

Dysregulation of the IL‐18–IFNγ axis in patients with classic cytokine storm syndromes as compared to patients with COVID‐19. A and B, Hierarchical clustering analyses showing multiple correlations by Spearman’s rank correlation test of serum biomarker levels in patients with active secondary HLH/MAS (n = 50) (A) and patients with critical COVID‐19 (n = 17) (B). Positive associations are depicted in red; negative associations are depicted in blue. C and E, Hierarchical clustering analyses of Spearman’s rank correlations between serum levels of IL‐6, IL‐18, IFNγ, and IFNγ signaling surrogates CXCL9 and CXCL10, as well as serum ferritin and thrombocyte cell counts, in patients with critical COVID‐19 (n = 17) (C) and patients with secondary HLH/MAS (n = 50) (E). D and F, Correlations of expression levels between the same serum biomarkers as indicated in C and E. In D, circles represent patients with critical COVID‐19, and diamonds represent patients who are deceased (n = 7). In F, orange circles represent patients with secondary HLH (n = 22), dark red circles represent patients with MAS (n = 28), and squares represent pediatric/adolescent patients with secondary HLH (n = 4) or MAS (n = 9). See Figure 1 for definitions.
