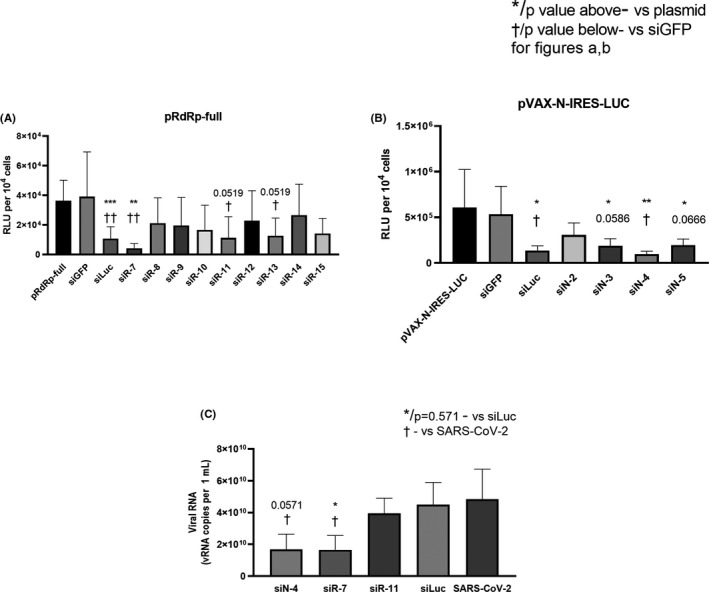
FIGURE 2.

Properties of designed siRNA. (A, B) Inhibition of gene expression with synthetic siRNA. Hep‐2 cells were transfected with each of the plasmids coding SARS‐CoV‐2 genes fused with firefly luciferase gene (pRdRp‐full) (A) or pVAX‐N‐IRES‐LUC (B) followed by transfection with SARS‐CoV‐2‐specific or control siRNA. siLuc and siGFP were used as positive and negative controls, respectively. LipofectamineTM 3000 was used as vehicle for both pDNA and siRNA. After 24 h cells were harvested and luciferase activity was determined. Data are expressed as relative light units (RLU) per 104 cells. Footnotes: */† or adjusted p value above/below represents the difference compared to cells transfected with plasmid only/non‐specific siGFP, respectively. *†p < 0.05, **††p < 0.01, ***p < 0.001. (D) Inhibition of SARS‐CoV‐2 reproduction with synthetic siRNA. Vero E6 cells were transfected with siRNA/ LipofectamineTM 3000 complexes. Media with complexes were removed four hours after transfection and cells were infected with SARS‐CoV‐2 at MOI 0.0001. Viral load was determined by qRT‐PCR. The results are expressed as number of viral RNA copies per mL. Footnotes: * or p = 0.571 represent differences with cells infected with SARS‐CoV‐2 and treated with non‐specific siLuc. † represent differences with SARS‐CoV‐2 only infected cells.*†p < 0.05. Differences between multiple groups were estimated using a Kruskal–Wallis test followed by post‐hoc testing (if the Kruskal–Wallis was significant) using un‐paired Mann–Whitney U tests. Bars show means of four (A, B) and five (C) independent experiments ± SDs
