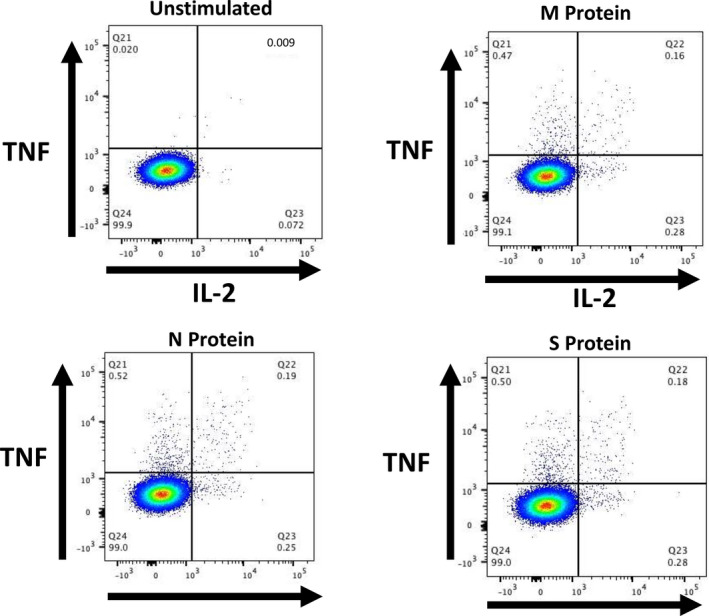
Fig 1.

Illustrative composite flow cytometry plots from a patient (aged 65 years) with essential thrombocythaemia demonstrating CD4+ cells expressing tumour necrosis factor α (TNFα) (y axes) and interleukin 2 (IL‐2) (x axes). Top left, unstimulated cells; top right, M protein; bottom left, N protein; bottom right, S protein. [Colour figure can be viewed at wileyonlinelibrary.com]
