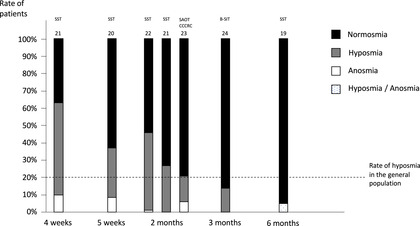
FIGURE 2.

Distribution of the rates of normosmia, hyposmia, and anosmia among patients infected by SARS‐CoV‐2, at 4 weeks, 5 weeks, 2 months, 3 months, and 6 months after the onset of the disease. Olfactory function was assessed using diverse psychophysical methods (SST, SAOT, CCCRC, and B‐SIT). References are reported at the top of the bar. The dashed horizontal line represents the rate of hyposmia among the general population. 25 B‐SIT, Brief Smell Identification Test; CCCRC, Connecticut Chemosensory Clinical Research Center; SAOT, self‐administrated olfactory test; SARS‐CoV‐2, severe acute respiratory syndrome‐coronavirus‐2; SST, Sniffin’ Sticks Test.
