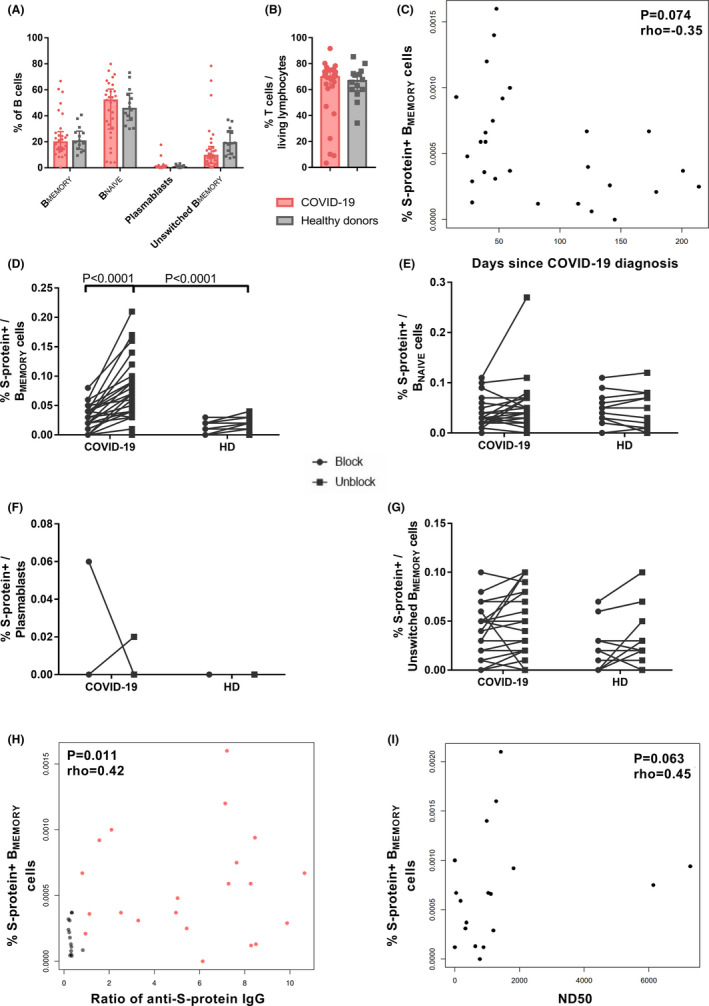
FIGURE 2.

Detection of COVID‐19‐specific BMEMORY cells using spike (S)‐protein. Peripheral blood mononuclear cells of convalescent COVID‐19 patients (n = 26) and healthy donors (n = 14) were incubated with 200 ng dissolved in 100 µl PBS (1:500) Cy5 as well as FITC fluorochrome‐labelled SARS‐CoV‐2 S‐protein with or without excess unlabelled protein to block labelling. For three COVID‐19 patients, follow‐up samples from two different time points were included. All but six samples of COVID‐19 patients were directly processed without prior freezing and storage. (A) Percentage of IgD− CD27+ BMEMORY, IgD+ CD27+unswitched BMEMORY, IgD+ CD27− BNAIVE and CD27++ CD38++plasmablasts within the entire B cell population analysed for COVID‐19 disease and healthy cohorts. Bars show median with interquartile range. Repeated measurements two‐way ANOVA did not detect significant differences between COVID‐19 patients and healthy donors. (B) Percentage of CD3+ T cells within living lymphocytes of COVID‐19 and healthy donors. Bars show median with interquartile range. Parametric distribution was assessed with Shapiro–Wilk normality test and two‐tailed Mann–Whitney test used for statistical comparison. (C) Correlation of fluorochrome labelled SARS‐CoV‐2 S‐protein binding B cells and days after COVID‐19 diagnosis. N = 27 samples of 24 COVID‐19 patients (three patients with two samples collected at different time points). The analysis was performed with Spearman's rank coefficient, rho = −0.34, p = .095. (D)–(G) Frequencies of S‐protein binding BMEMORY (D), BNAIVE (E), plasmablasts (F), and unswitched BMEMORY cells (G) after staining with preincubation of unlabelled Covid‐19 antigen (blocked, left) and without preincubation (not blocked staining, right) samples. N = 26 COVID‐19 patients and n = 14 healthy donors. Only the first sample of patients with multiple samples was included. Statistical comparison was done with two‐way repeated measurements ANOVA and Sidak's multiple comparisons test. (H) Correlation of fluorochrome labelled SARS‐CoV‐2 S‐protein binding BMEMORY‐cells and anti‐S1/S2‐IgG. Red dots: 21 samples of 19 COVID‐19 patients (two patients with two samples collected at different time points). Grey dots: 14 healthy donors. Analysis was performed with Spearman's rank coefficient, rho = .42, p = .011. (I) Correlation of fluorochrome labelled SARS‐CoV‐2 S‐protein binding BMEMORY‐cells and serum 50% neutralization dose titre (ND50). Virus neutralization was assessed using a propagation incompetent vesicular stomatitis pseudovirus system bearing SARS‐CoV‐2 S‐protein. N = 18 samples of 17 patients (one patient with two samples collected at different time points). Analysis was performed with Spearman's rank coefficient, rho = .45, p = .063
