
FIGURE 3.
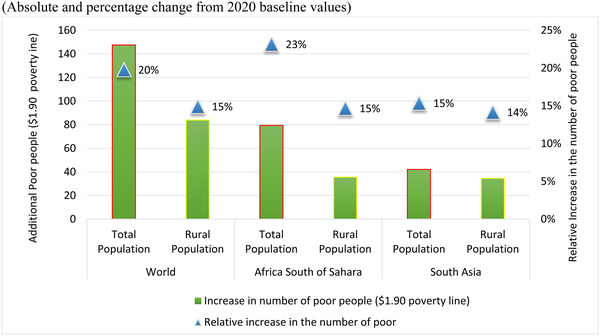
Global and Regional Poverty Impacts of MIRAGRODEP‐COVID 19 scenario (April 2020) by selected regions (Absolute and percentage change from 2020 baseline values) [Color figure can be viewed at wileyonlinelibrary.com]
Source: MIRAGRODEP and POVANA Simulations.