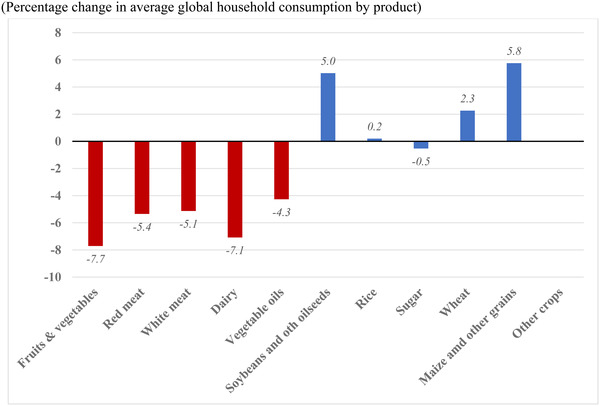
FIGURE 4.

COVID‐19 impacts on diets (average effect for world) (percentage change in average global household consumption by product) [Color figure can be viewed at wileyonlinelibrary.com]
Source: MIRAGRODEP Simulation (April 2020 scenario).
Note: Global average based on weighted changes at the estimated at the country or regional levels. Weights are based on base value of consumption, while changes are computed on the evolution of the volume of consumption for each national representative household.
