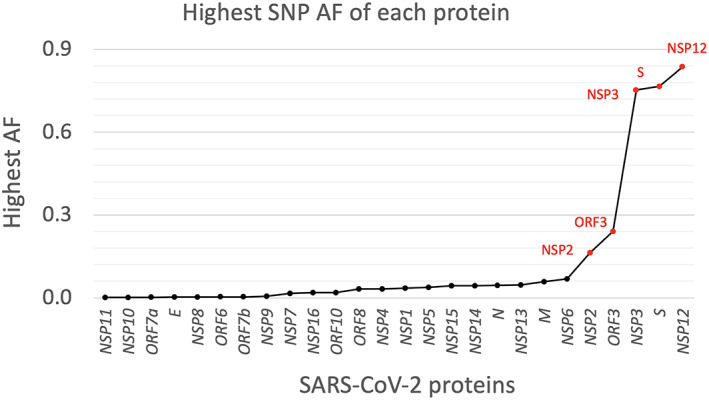
Fig 1.

Distribution of the highest allele frequency (AF) of all called mutations (SNPs and deletions) in each protein from 193,687 strains. The label of the proteins with a percentage larger than 10% are shown and marked in red. AF = allele frequency. The y‐axis shows the highest mutation rate (i.e., the highest allele frequency) of all observed mutations from all 193 k isolates. [Color figure can be viewed at wileyonlinelibrary.com]
