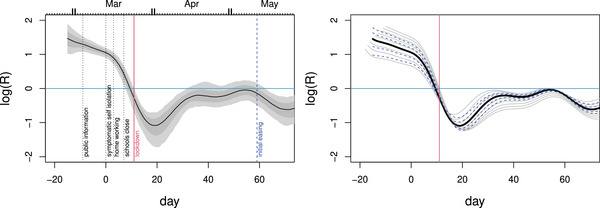
FIGURE 3.

Left: Estimates and confidence bands for the effective reproduction number, R, from a simple SEIR model given the inferred infection profile (incidence), . The assumed mean time to infectivity was days and the mean infectivity duration was days. The labelled vertical bars show policy change dates in March 2020. Given the rapidity of policy change relative to the epidemic's dynamic time scale, and government policy sometimes lagging behaviour, casual over interpretation of these timings should be avoided. Right: sensitivity analysis. Dashed blue: time to infectivity was varied from 1 to 5 days. Grey:‐ duration of infectivity was varied from 2 to 10 days. Logs are natural. R appears to be below 1 before full lockdown, but fell further after it. This figure appears in colour in the electronic version of this article, and any mention of colour refers to that version
