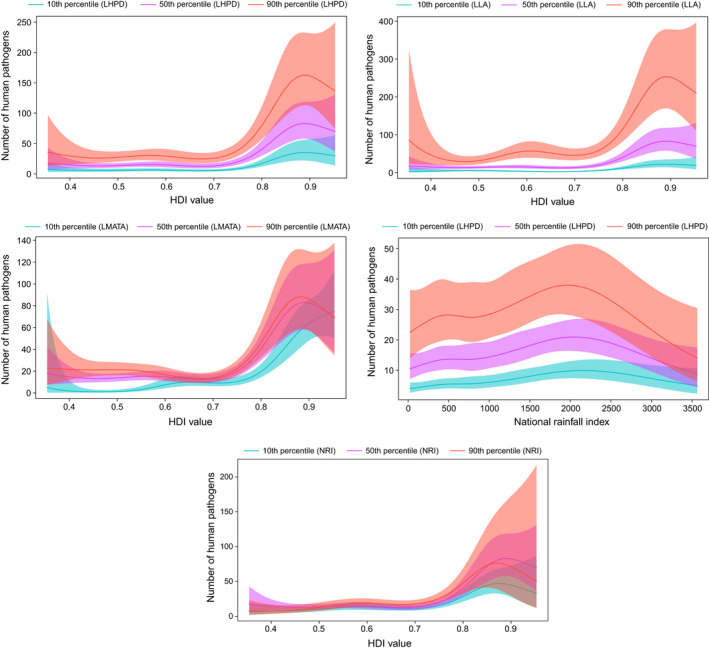
FIGURE 5.

Smoothed curves of the additive effect to the estimated number of human pathogens (original data–uncontrolled research effort) for the individual environmental and social parameters in the generalized additive model. Shaded areas represent 95% confidence intervals. Plots showing the significant interactions among smoothed terms are presented. p‐value for all variables <.001 except for interaction effect human development index value and national rainfall index (p = .03). LHPD, Log human population density; LLA, Log land area; LMATA, Log mean annual temperature average; NRI, National rainfall index
