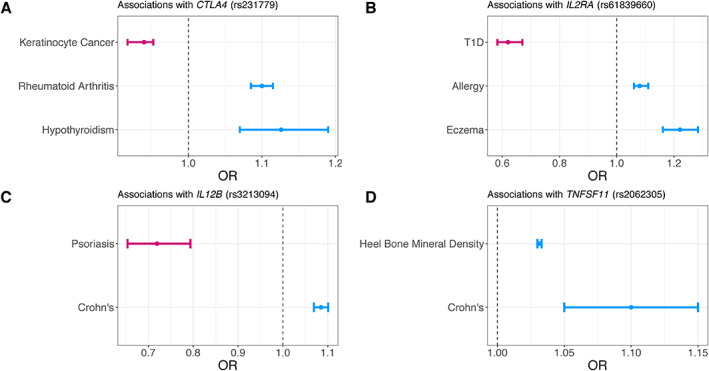
Figure 2.

Effect sizes for variants in four genes from OpenGWAS and GWAS Catalog. Odds ratios (OR) and 95% confidence intervals for four gene–disease indication sets are shown. Colors represent directions of association (pink: OR < 1, blue: OR > 1). Effect sizes are for (A) rs231779 (CTLA4) in hypothyroidism, rheumatoid arthritis, and keratinocyte cancer; (B) rs61839660 (IL2RA) in type I diabetes (T1D), allergy, and eczema; (C) rs3213094 (IL12B) in psoriasis and Crohn's disease; (D) rs2062305 (TNFSF11) in heel bone mineral density and Crohn's disease, in the European population. Association summary statistics are accessed via the GWAS Catalog and OpenGWAS API [79, 80].
