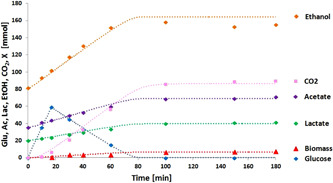
Figure 5.

Product formation during a representative cycle (day 121) fitted with a data evaluation model in which an assumed lumped stoichiometry for glucose conversion was used. The symbols represent measured data points, while the dotted lines represent the model [Color figure can be viewed at wileyonlinelibrary.com]
