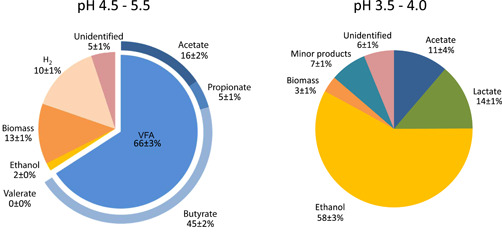
Figure 9.

Comparison between the product spectra on chemical oxygen demand basis of the effluent of the bioreactor operated at pH 4.5–5.5 in an earlier study (Tamis et al., 2015) and pH 3.5–4.0 in this study. VFA, volatile fatty acid [Color figure can be viewed at wileyonlinelibrary.com]
