
FIGURE 5.
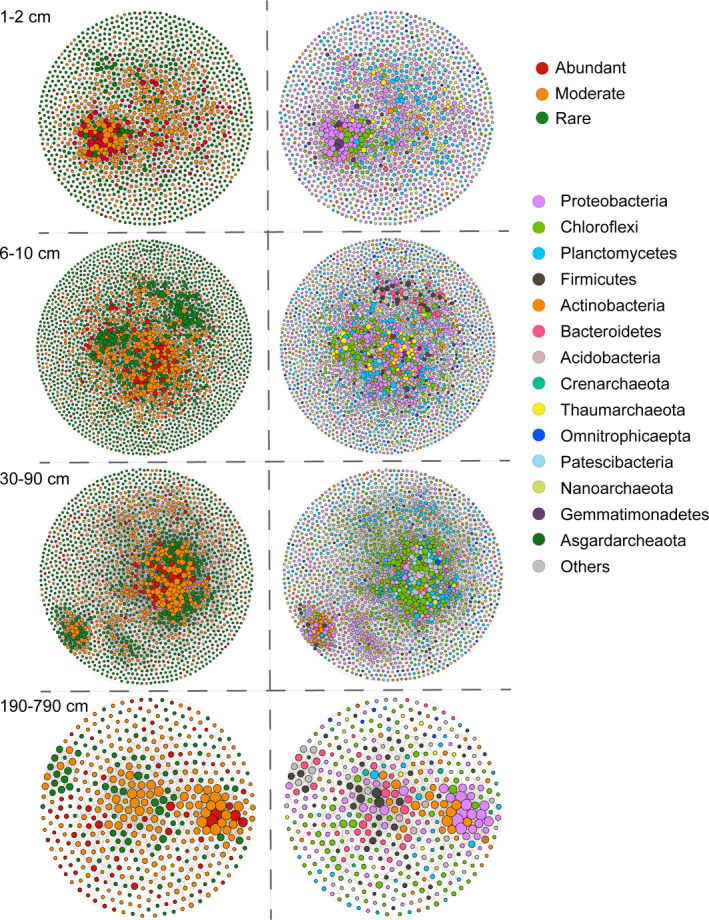
Co‐occurrence networks of the microbial community in each depth group. Each connection shown has a correlation coefficient > |.7| and a p value <.01. The size of each node is proportional to the number of connections. The OTUs were coloured by subcommunity and taxonomy, respectively