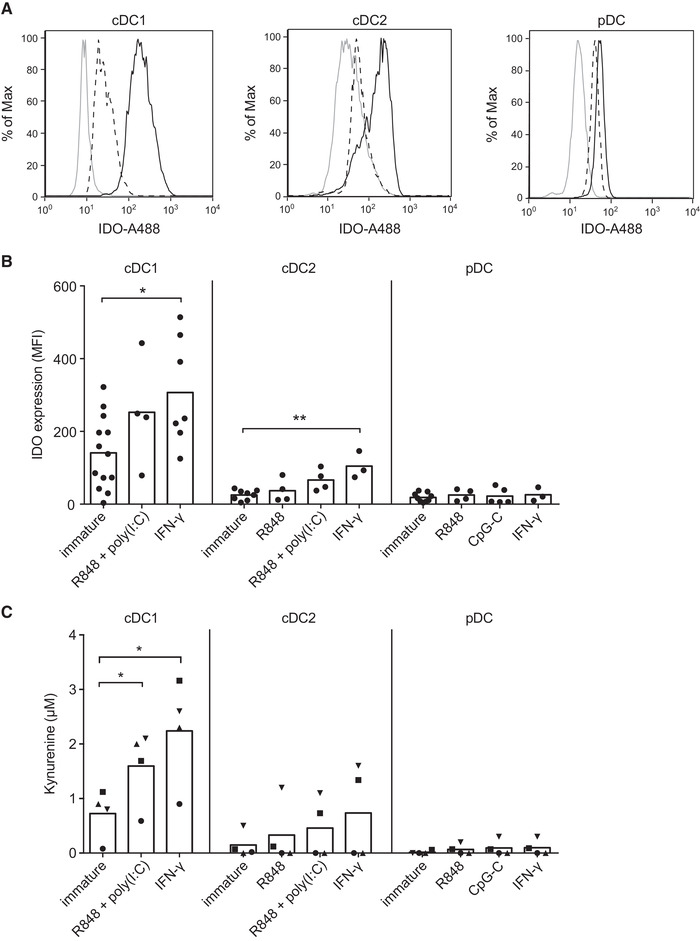
Figure 3.

IDO protein expression and activity among stimulated blood DC subsets. (A) Flow cytometry histograms from a representative donor showing isotype control (solid grey line), IDO expression in absence of stimulus (dashed black line), and IDO expression for either IFN‐γ or CpG‐C stimulation (solid black line) for cDCs or pDCs, respectively. (B) The figure shows the geometric mean fluorescence intensity (MFI) of IDO expression subtracted by the MFI of the isotype control, with at least 3 different donors per condition from 10 independent experiments. Bars represent means. Significance was determined by one‐way ANOVA with Bonferroni correction, comparing stimulated DCs with immature control (* P < 0.05; ** P < 0.01). (C) IDO activity was analyzed by measuring l‐kynurenine in supernatants of 24‐h DC cultures by HPLC. The results are from six different donors from four independent experiments; in one experiment (squares), pooled supernatants from 3 different donors were used. Bars represent means and symbols correspond to measurements belonging to the same donors. Significance was determined by repeated measures one‐way ANOVA with Bonferroni correction, comparing stimulated DCs with their immature control (* P < 0.05).
