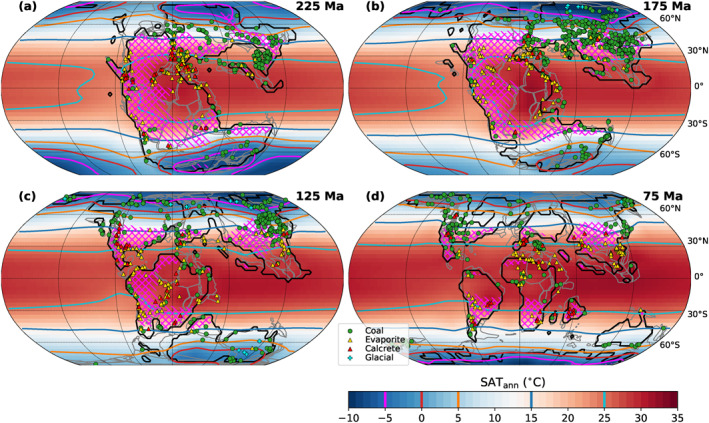
Figure 4.

Simulated annual mean surface air temperatures (SATann, colors, and contours) and arid regions (pink hatches) for four selected Mesozoic timeslices (225, 175, 125, 75 Ma) at pCO2 = 1,000 ppm. Colors and contours: annual mean SAT for the P pCO2_1000ppm pathway. Pink hatches: Relatively dry regions based on an aridity index <1.5 (see Section 3.5 for further explanation). “///” hatches are for 1,000 ppm and “\\\” hatches for 500 ppm. Markers: Locations of climatic indicators from Boucot et al. (2013). Coal and evaporite/calcrete occurrences are generally viewed as indicators for humid or dry conditions, respectively, and are thus qualitatively compared with the extent of simulated hatched arid regions here (see Section 3.5). In contrast to, for example, glacial deposits, they cannot be interpreted primarily as temperature proxies. Gray lines indicate the tectonic plate boundaries in the rotation model of Scotese (2008) (as published by Cao et al., 2018).
