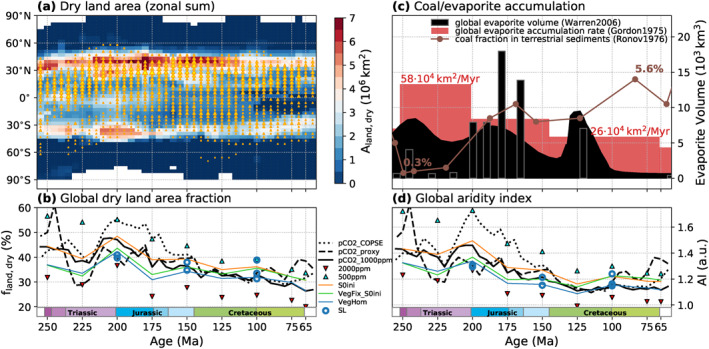
Figure 7.

Extent (a and b) and intensity (d) of simulated dry continental climate conditions through the Mesozoic. (a) Zonal sum of dry land area (aridity index AI < 1.5, see Section 3.5) for all timeslices of the P pCO2_1000ppm pathway (also see hatched areas in Figure 4). Triangles indicate the occurrence and frequency of evaporites in the data set of Boucot et al. (2013) at a given time and latitude. The size of the triangles scales with the number of occurrences in the respective time interval and latitudinal band (normalized with respect to its area). (b) Global fraction of land area experiencing dry climate conditions (AI < 1.5) for different boundary condition pathways. (d) Global aridity index based on the global mean values of precipitation and surface radiation balance on land. (c) Proxy estimates of global coal and evaporite accumulation (Gordon, 1975; Ronov et al., 1980; Warren, 2006).
