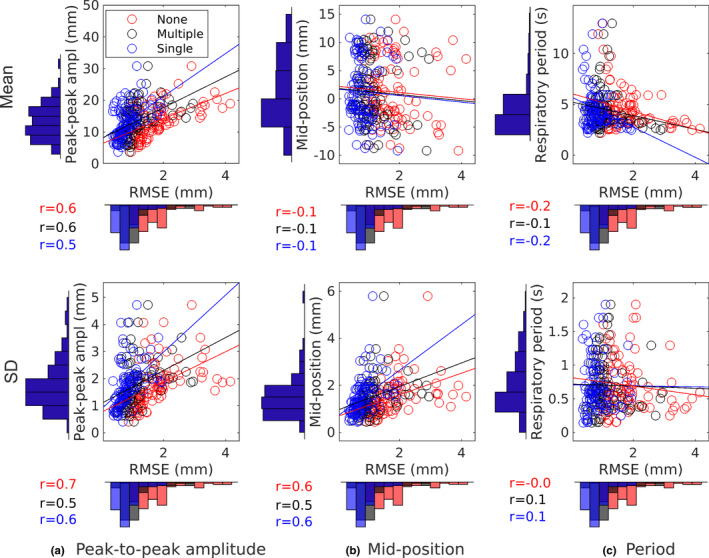
Fig. 3.

Influence of respiratory characteristics on prediction performance of different predictor training approaches for a 250 ms lookahead length and a 4 Hz sampling rate. Histograms show the distribution of the respiratory characteristics and of the root‐mean‐squared error scores. Respiratory characteristics are presented in terms of mean (top row) and SD (bottom row).
