
Figure 5.
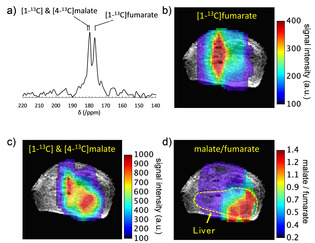
In vivo CSI of hyperpolarized [1‐13C]fumarate metabolism in an acetaminophen‐induced hepatitis mouse. a) Representative 13C NMR spectrum of hyperpolarized [1‐13C]fumarate and its metabolite for a CSI pixel at the liver. b) Map of hyperpolarized [1‐13C]fumarate CSI signal intensity overlaid on an anatomical 1H MRI image. c) Map of hyperpolarized [1‐13C] and [4‐13C]malate. d) parametric map of the malate/fumarate ratio; a biomarker of cellular necrosis.