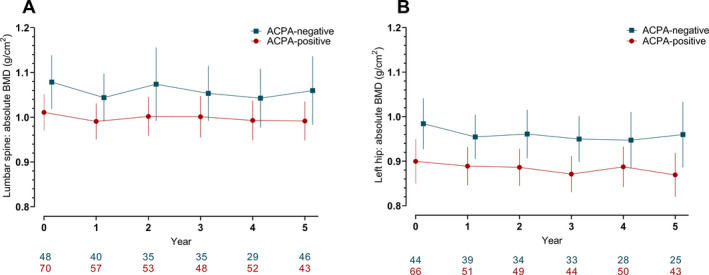
Figure 2.

Raw data plots illustrating the yearly change in BMD measurements in 128 Dutch patients with rheumatoid arthritis who had high disease activity and who were categorized by ACPA status. High disease activity was classified as a patient having a mean Disease Activity Score of >1.8 during the first two years after study inclusion (baseline visit not included). BMD was measured at the lumbar spine (A) and left hip (B). Values below the graphs represent the number of patients with available DXA scans for each given time point in the ACPA‐positive and the ACPA‐negative group. Results are shown as the mean with error bars showing the 95% confidence intervals for both groups at the given time points. See Figure 1 for definitions.
