
FIGURE 3.
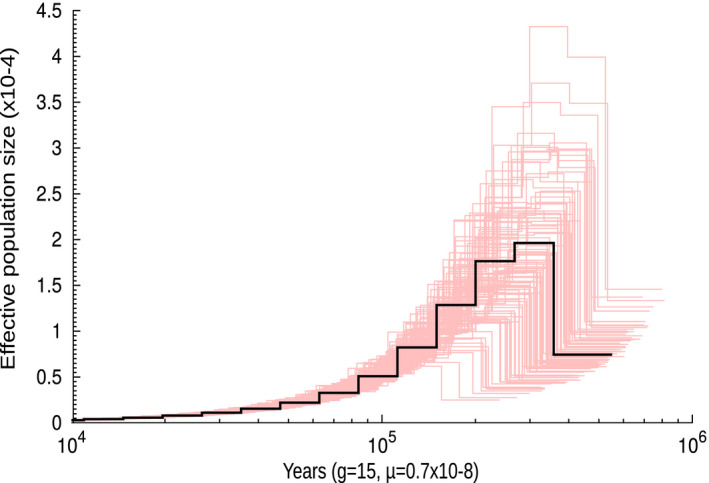
Population size variation in soursop. Effective population size history inferred by the PSMC method (black line), with 100 bootstraps shown (red lines).
Official websites use .gov
A
.gov website belongs to an official
government organization in the United States.
Secure .gov websites use HTTPS
A lock (
) or https:// means you've safely
connected to the .gov website. Share sensitive
information only on official, secure websites.
Population size variation in soursop. Effective population size history inferred by the PSMC method (black line), with 100 bootstraps shown (red lines).