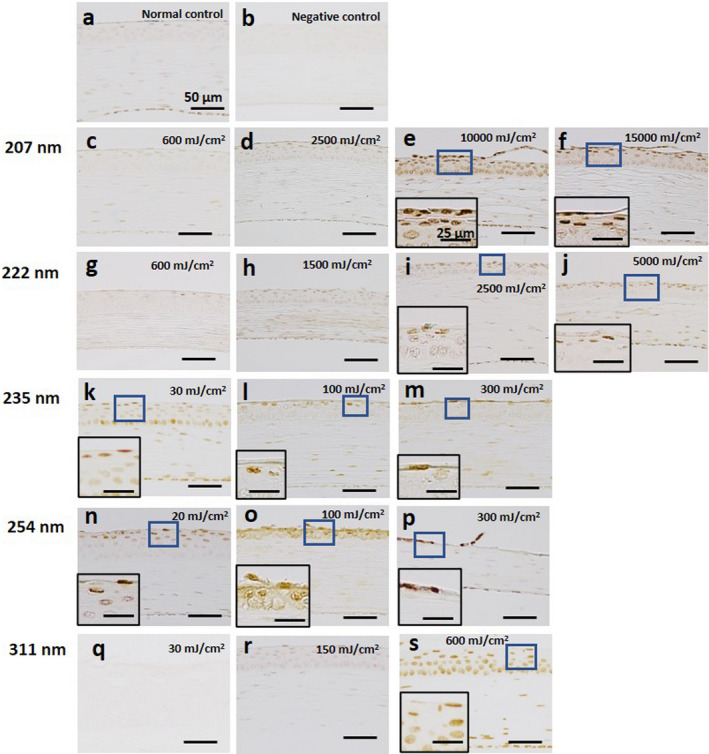
Figure 6.

Expression of CPDs in the cornea. (a) Unexposed normal control. (b) Negative control. (c–f) The cornea irradiated by 207‐nm UV‐C. (g–j) The cornea irradiated by 222‐nm UV‐C. (k–m) The cornea irradiated by 235‐nm UV‐C. (n–p) The cornea irradiated by 254‐nm UV‐C. (q–s) The cornea irradiated by 311‐nm UV‐B. Small box indicates the high‐magnification images of the part surrounded by the blue line. Bar = 50 µm in each panel and 25 µm in high‐magnification images.
