
FIGURE 5.
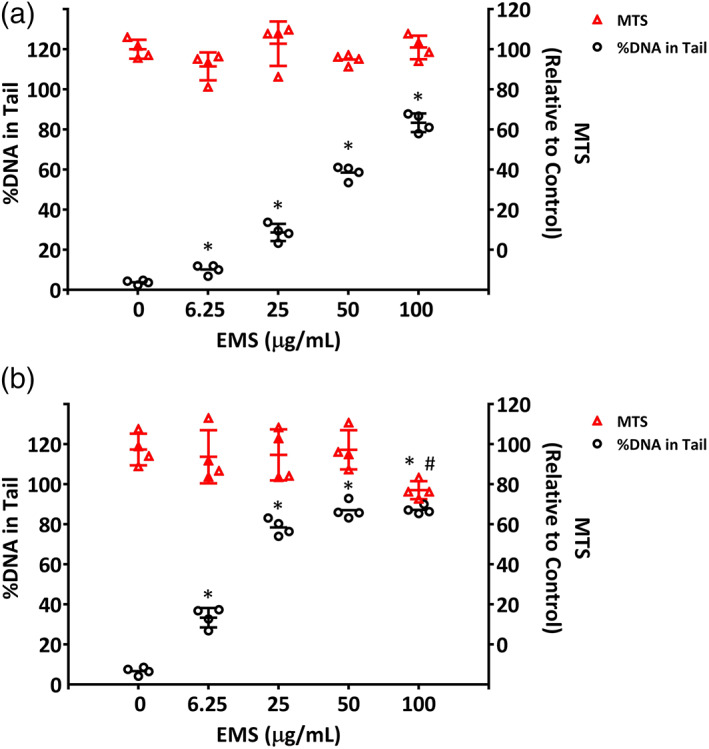
DNA damage in EMS‐treated ALI airway cultures. DNA damage (DNA strand breaks and alkali‐labile sites measured as %DNA in Tail) was detected using the CometChip assay and the relative cell viability (% of control) was measured using the MTS assay after (a) 3‐day and (b) 28‐day treatments. Values for %DNA in Tail for individual cultures (n = 4) (black hollow circles) are plotted on the left Y‐axis, with the mean ± SD shown; corresponding values for relative cell viability (% of control) (red squares) are plotted on the right Y‐axis, along with their mean ± SD. To promote their visualization, the results for different treatment concentrations are spaced evenly along the X‐axis, without regard to relative concentration. *,# p < .05 was considered statistically significant compared to the respective vehicle controls; different symbols refer to comparisons made using different assays. A table with primary data has been included as Supporting Information