
FIGURE 7.
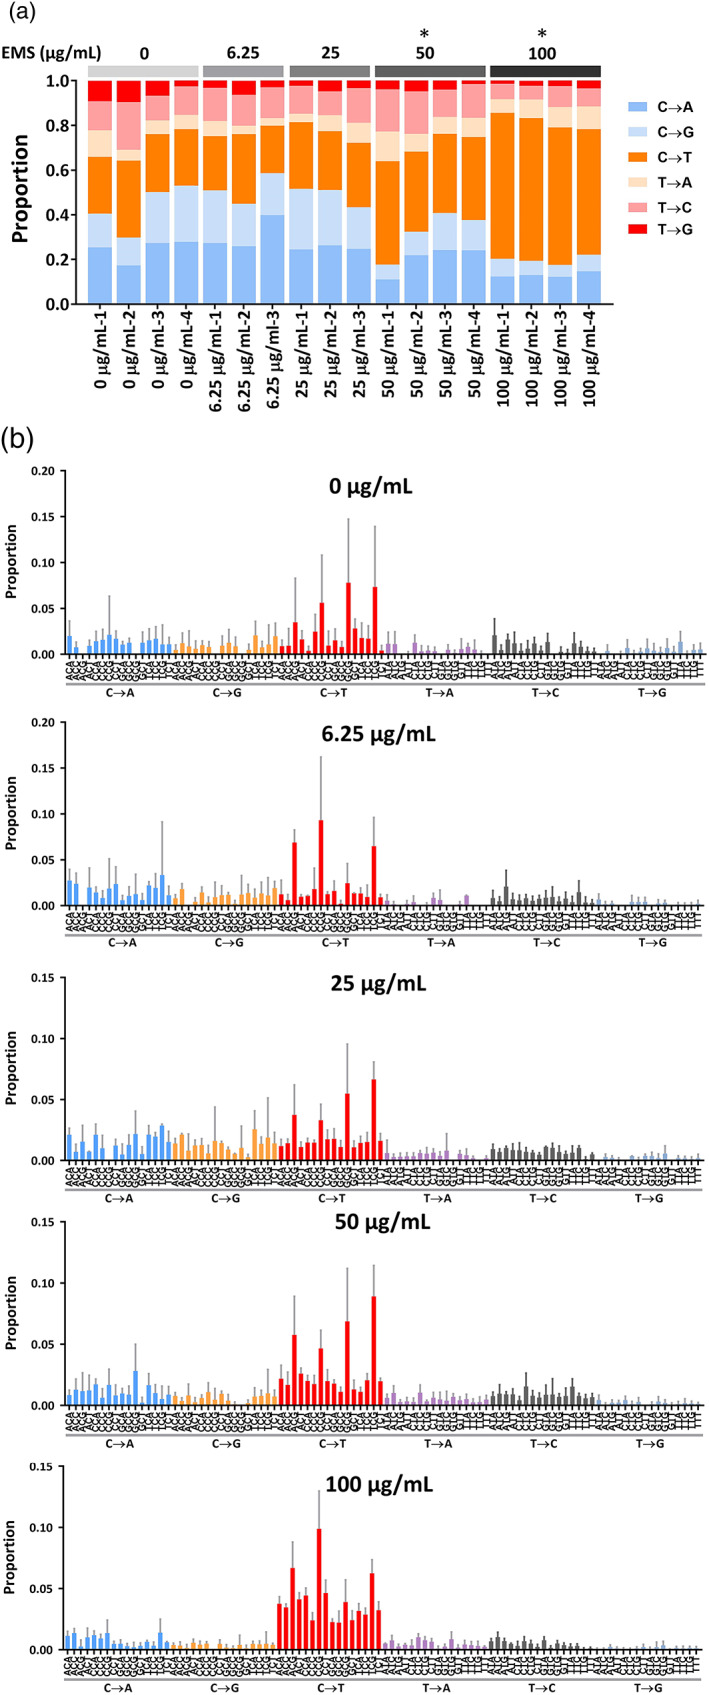
Mutation spectra analysis. (a) Proportions of simple base substitutions are plotted for each sample. *p < .05 was considered statistically significant differences in the proportion of C → T transitions, when compared to the concurrent vehicle control. (b) Trinucleotide spectra of treatment groups show distinct patterns of mutagenesis specific to EMS treatment