Fig. 12.

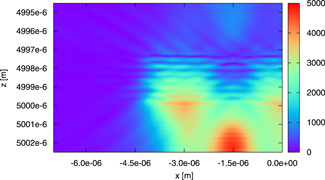
A color image of on the plane (passing through the center of gravity of the central mitochondrion of each layer). The field is computed for the model in Figure 4 by using μm, , and μa,m = 150 m−1.

A color image of on the plane (passing through the center of gravity of the central mitochondrion of each layer). The field is computed for the model in Figure 4 by using μm, , and μa,m = 150 m−1.