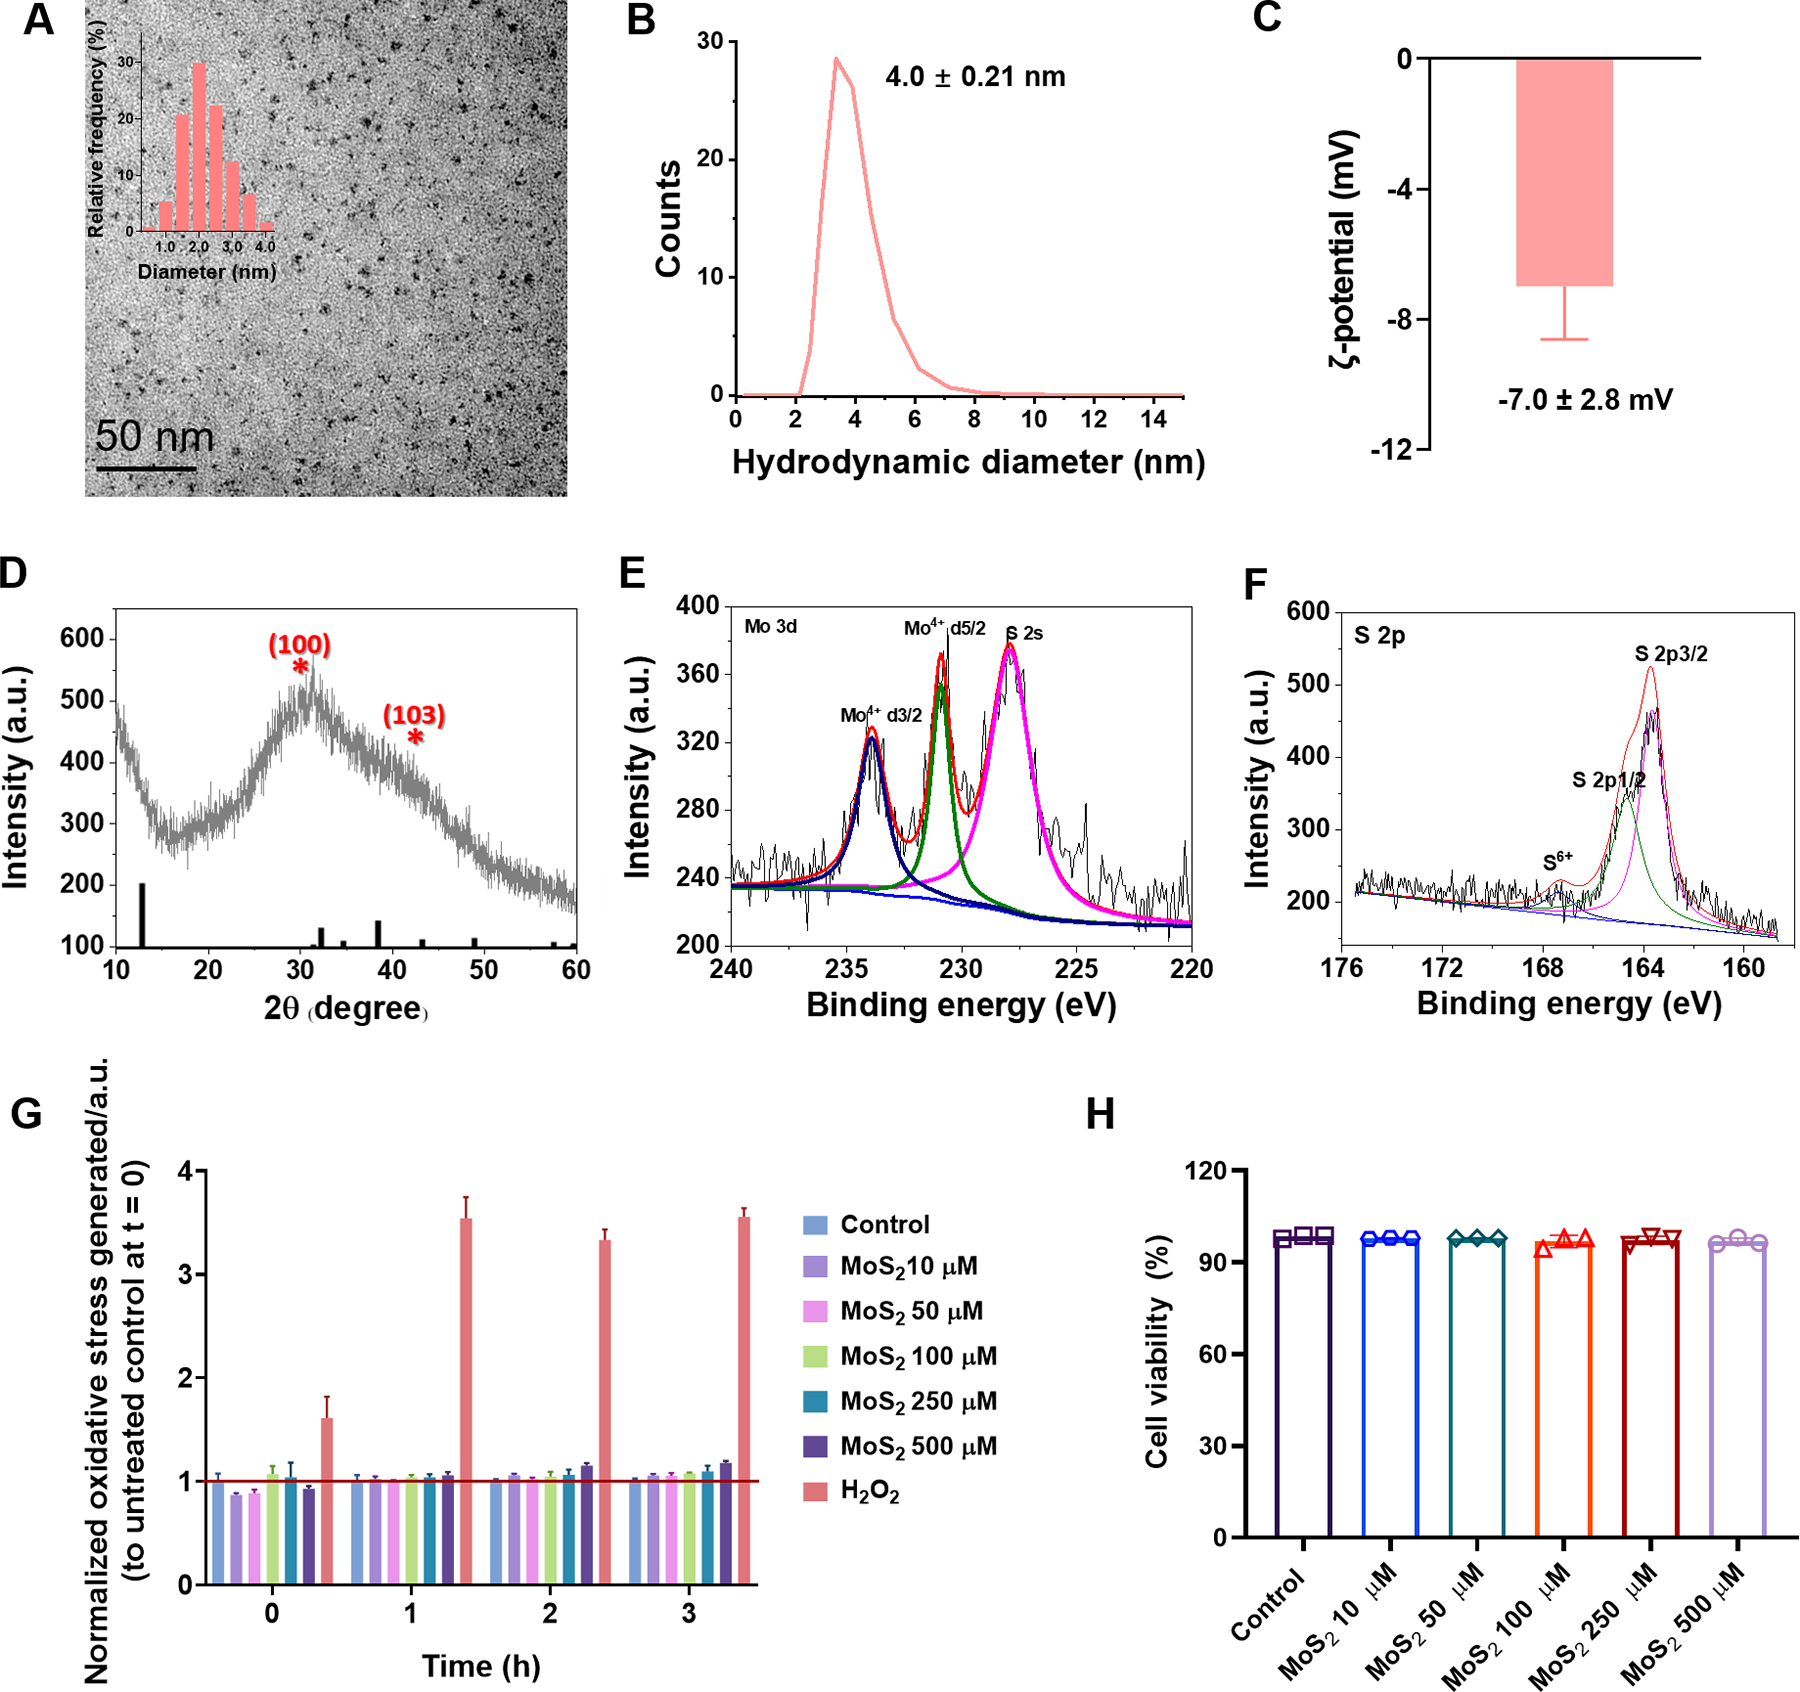
Figure 1. Characterizations of ultrasmall MoS2 QDs.

(A) TEM imaging of ultrasmall MoS2 QDs and their corresponding diameter distribution (inset). (B, C) Hydrodynamic diameter and ζ-potential measurement of the ultrasmall MoS2 QDs. (D) XRD detection of the ultrasmall MoS2 QDs. (E, F) The Mo 3d, S 2s, and S 2p regions of the XPS spectrum for the ultrasmall MoS2 QDs. (G) ROS measurements over a time course of 0 h to 3 h and (H) 24 h cell viability for different concentrations of the ultrasmall MoS2 QDs at SH-SY5Y cells. Data are shown as the mean (n=3) ± SEM and statistical analysis was performed through two-tailed Student’s t-test. Compared with control, there was no significant difference observed in the ultrasmall MoS2 QDs.
