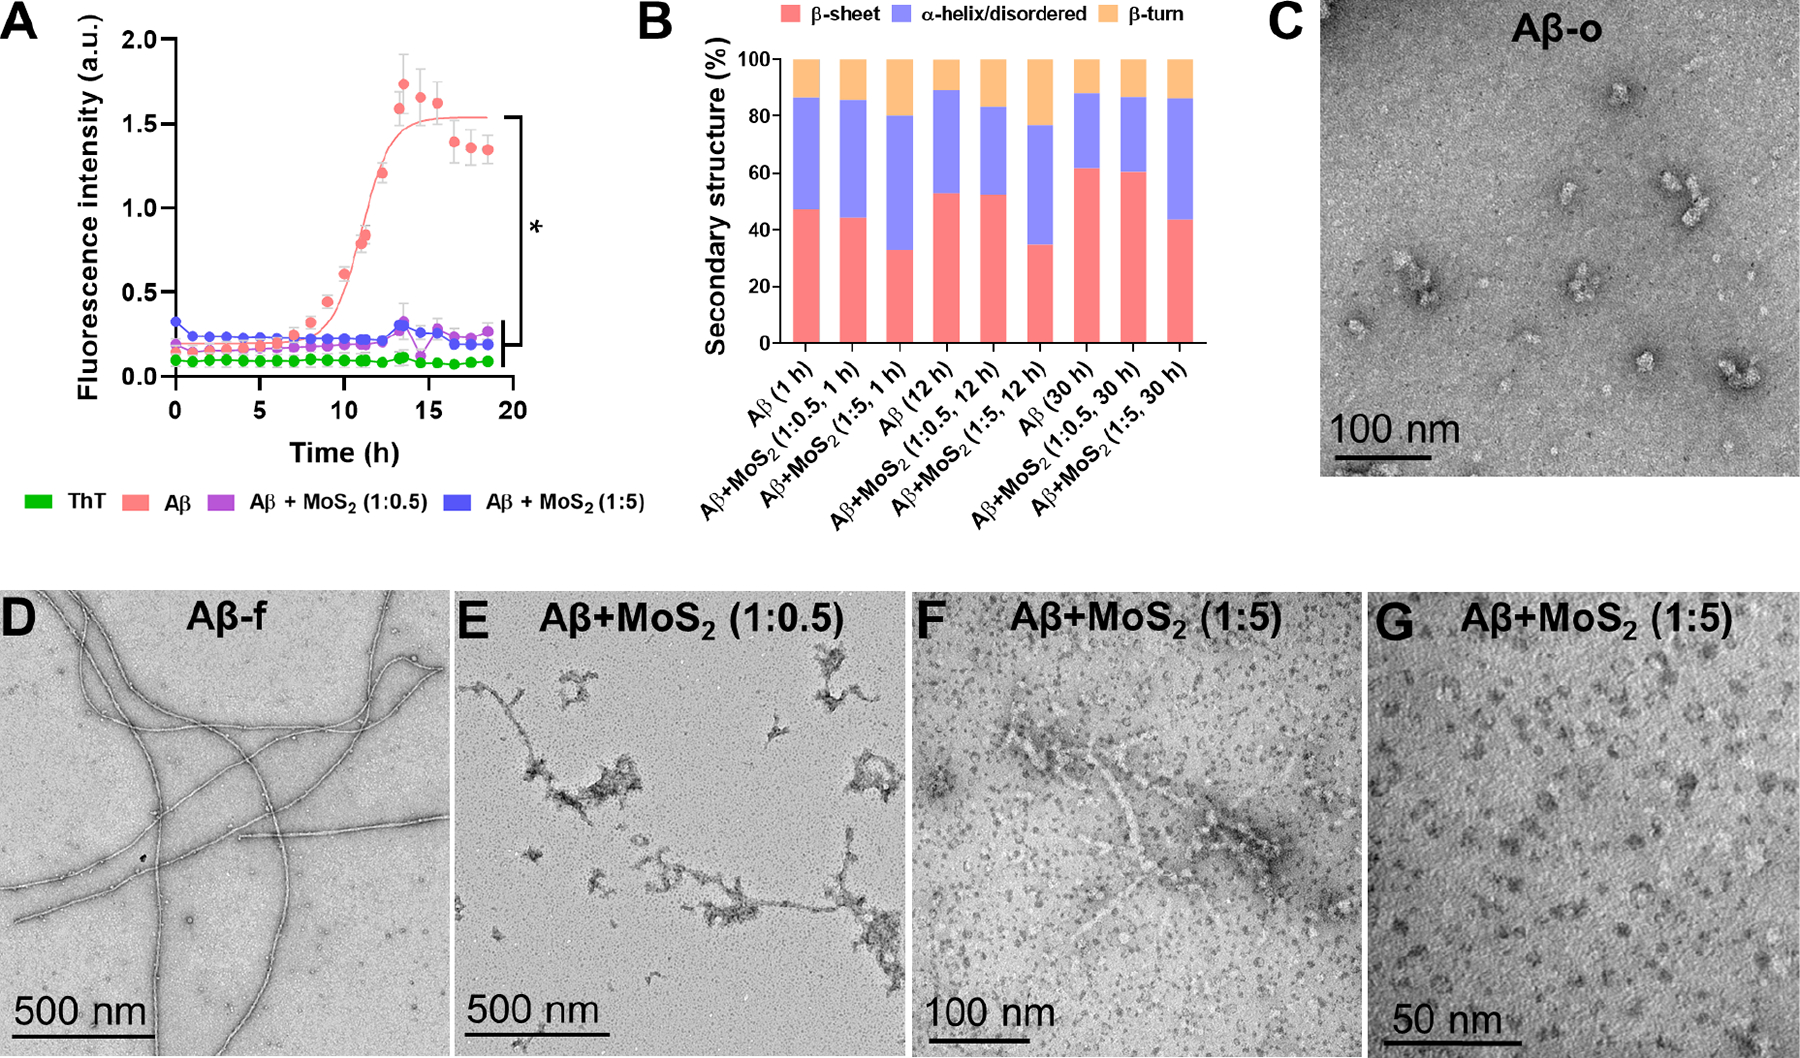
Figure 2. Inhibitory effects of ultrasmall MoS2 quantum dots on Aβ.

(A) Aβ (50 μM) aggregation in the presence and absence of ultrasmall MoS2 QDs at the molar ratio of 1:0.5 and 1:5 (Aβ/MoS2 QDs), monitored by a ThT fluorescence kinetic assay. ThT (100 μM) was used as control and data points were depicted as mean values of repeated measurements (n=3) ± standard errors of the mean (SEM) via two-tailed Student’s t-test analyzed at 18 h timepoint, *compared with Aβ, P < 0.05. (B) Secondary structure distribution of incubated (1, 12 and 30 h) Aβ 50 μM in the presence and absence of ultrasmall MoS2 QDs. Secondary structure analysis (%) was derived after deconvolution of the respective ATR-FTIR raw spectra presented in Figures S5&S6. (C-G) TEM imaging of Aβ aggregation in the presence and absence of ultrasmall MoS2 QDs. Aβ concentration: 50 μM. Incubation: 12 h for panel C and 30 h for panels D-G.
