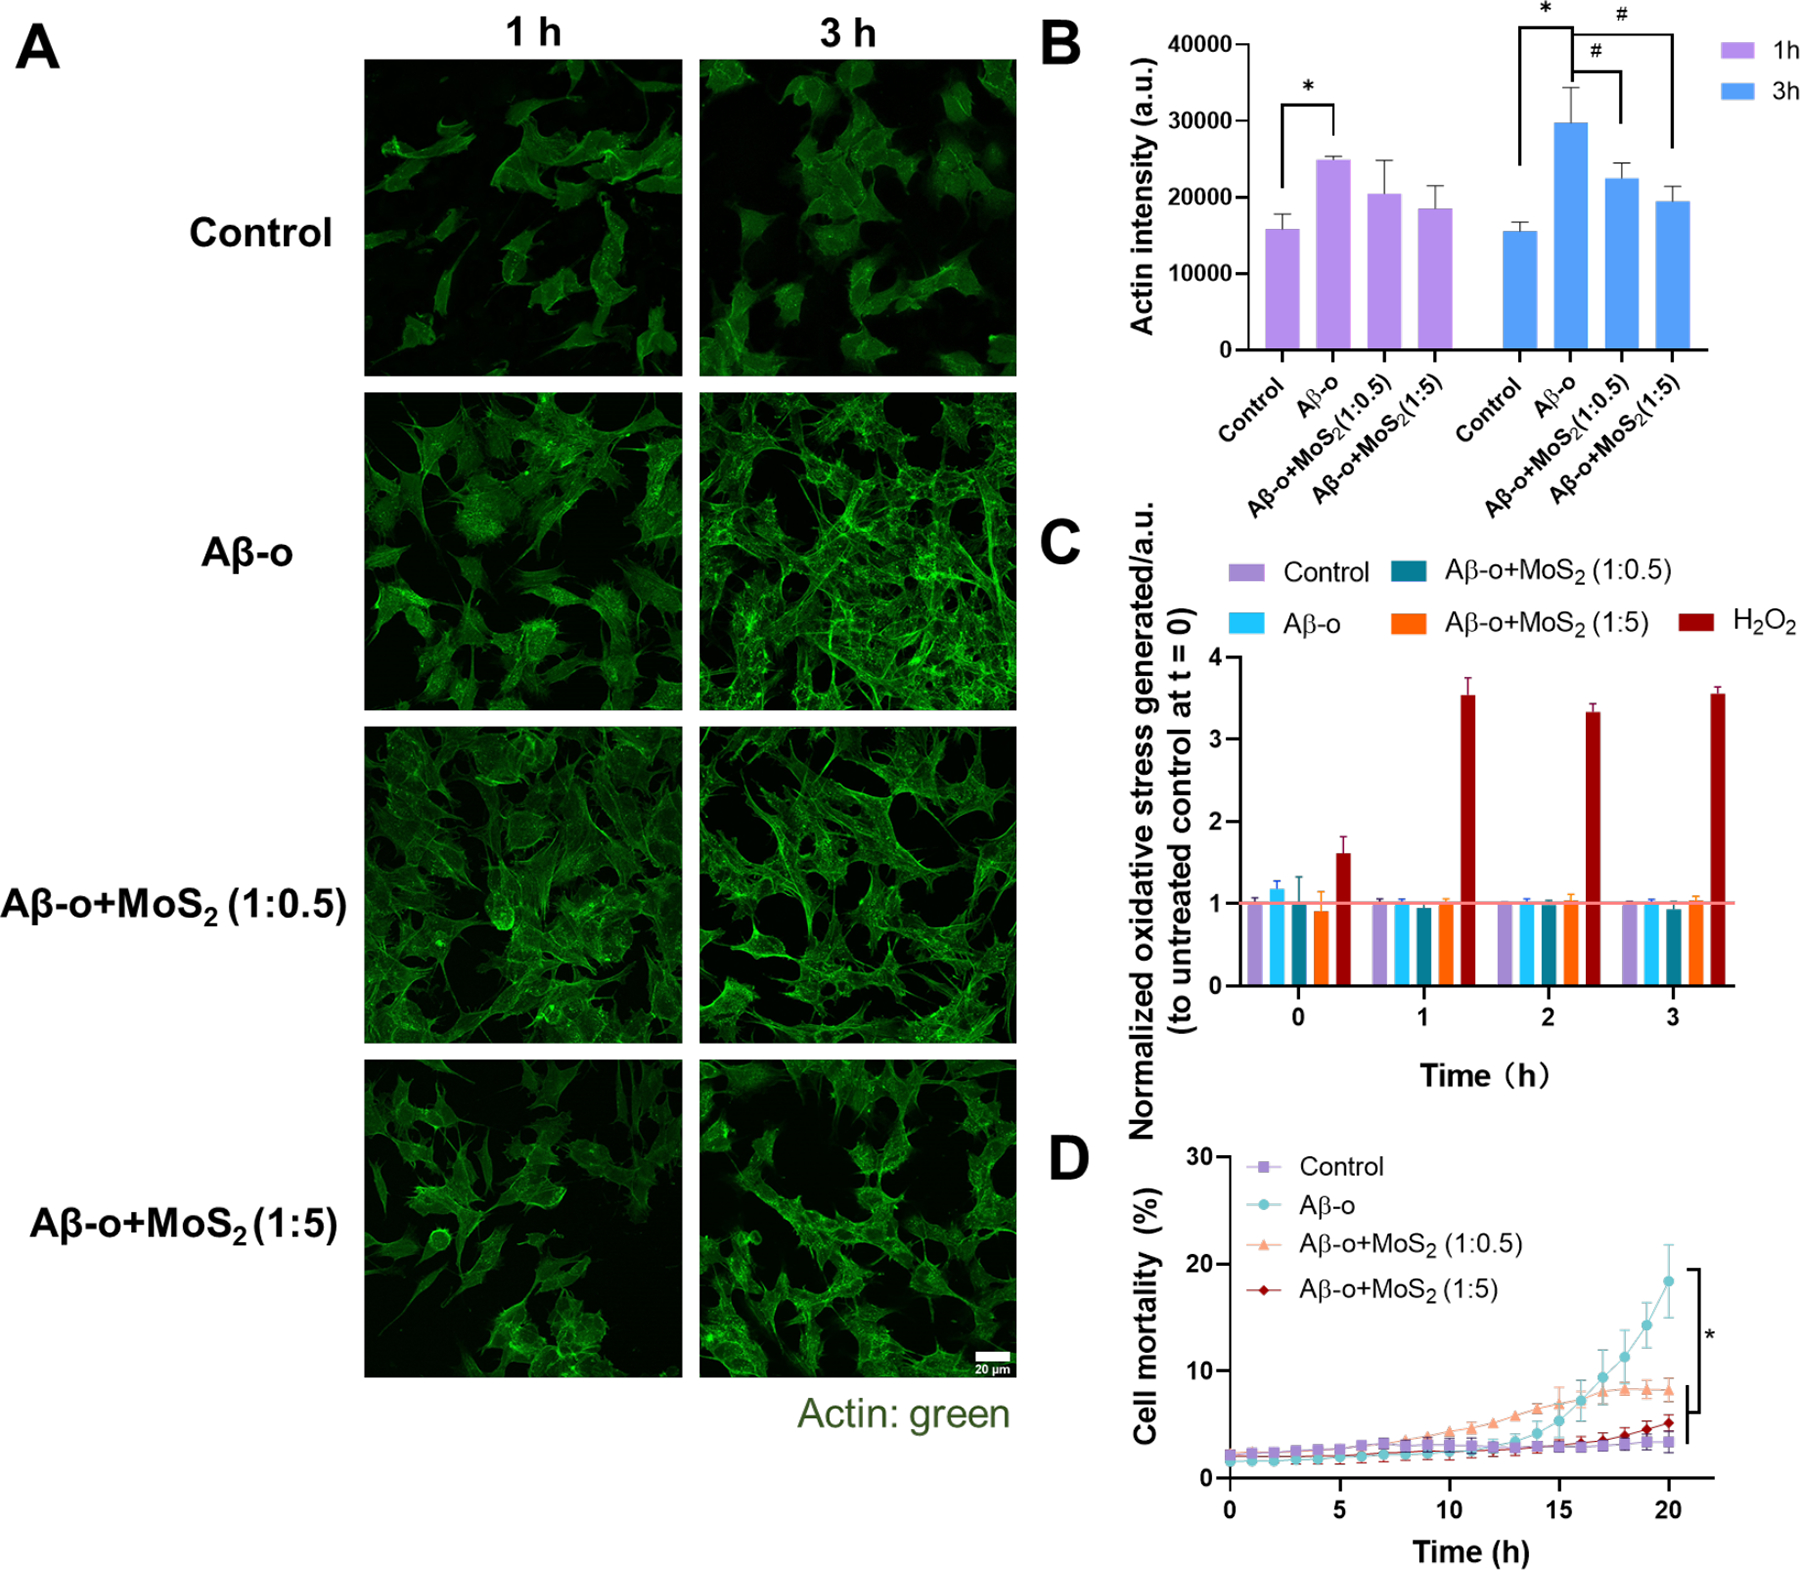
Figure 4. Actin organization, ROS generation and cell viability detection at SH-SY5Y cells after exposure to Aβ-o (20 μM) in the presence and absence of ultrasmall MoS2 QDs with the molar ratios of 1:0.5 and 1:5.

(A) Immunofluorescence imaging of actin filaments after 1 and 3 h treatment of Aβ-o (20 μM) and ultrasmall MoS2 QDs (10 and 100 μM). Actin filaments were stained by the phalloidin-iFluor 488 (green). Scale bar: 20 μm. (B) The calculation of actin filaments intensity according to panel A. Data points are depicted as mean values (n=3) ± SEM, via two-tailed Student’s t-test, *P < 0.05 compared with control group, #P < 0.05 compared with Aβ-o. (C) ROS production of SH-SY5Y cells were identified by H2DCFDA staining after 3 h treatment with Aβ-o and the combination of ultrasmall MoS2 QDs. H2O2 (200 μM) was used as positive control. (D) Cell viability after 20 h treatment with Aβ-o and the combination of ultrasmall MoS2 QDs. Data are shown as mean values (n=3) ± SEM, via two-tailed Student’s t-test analyzed at 20 h, *compared with Aβ-o, P < 0.05.
