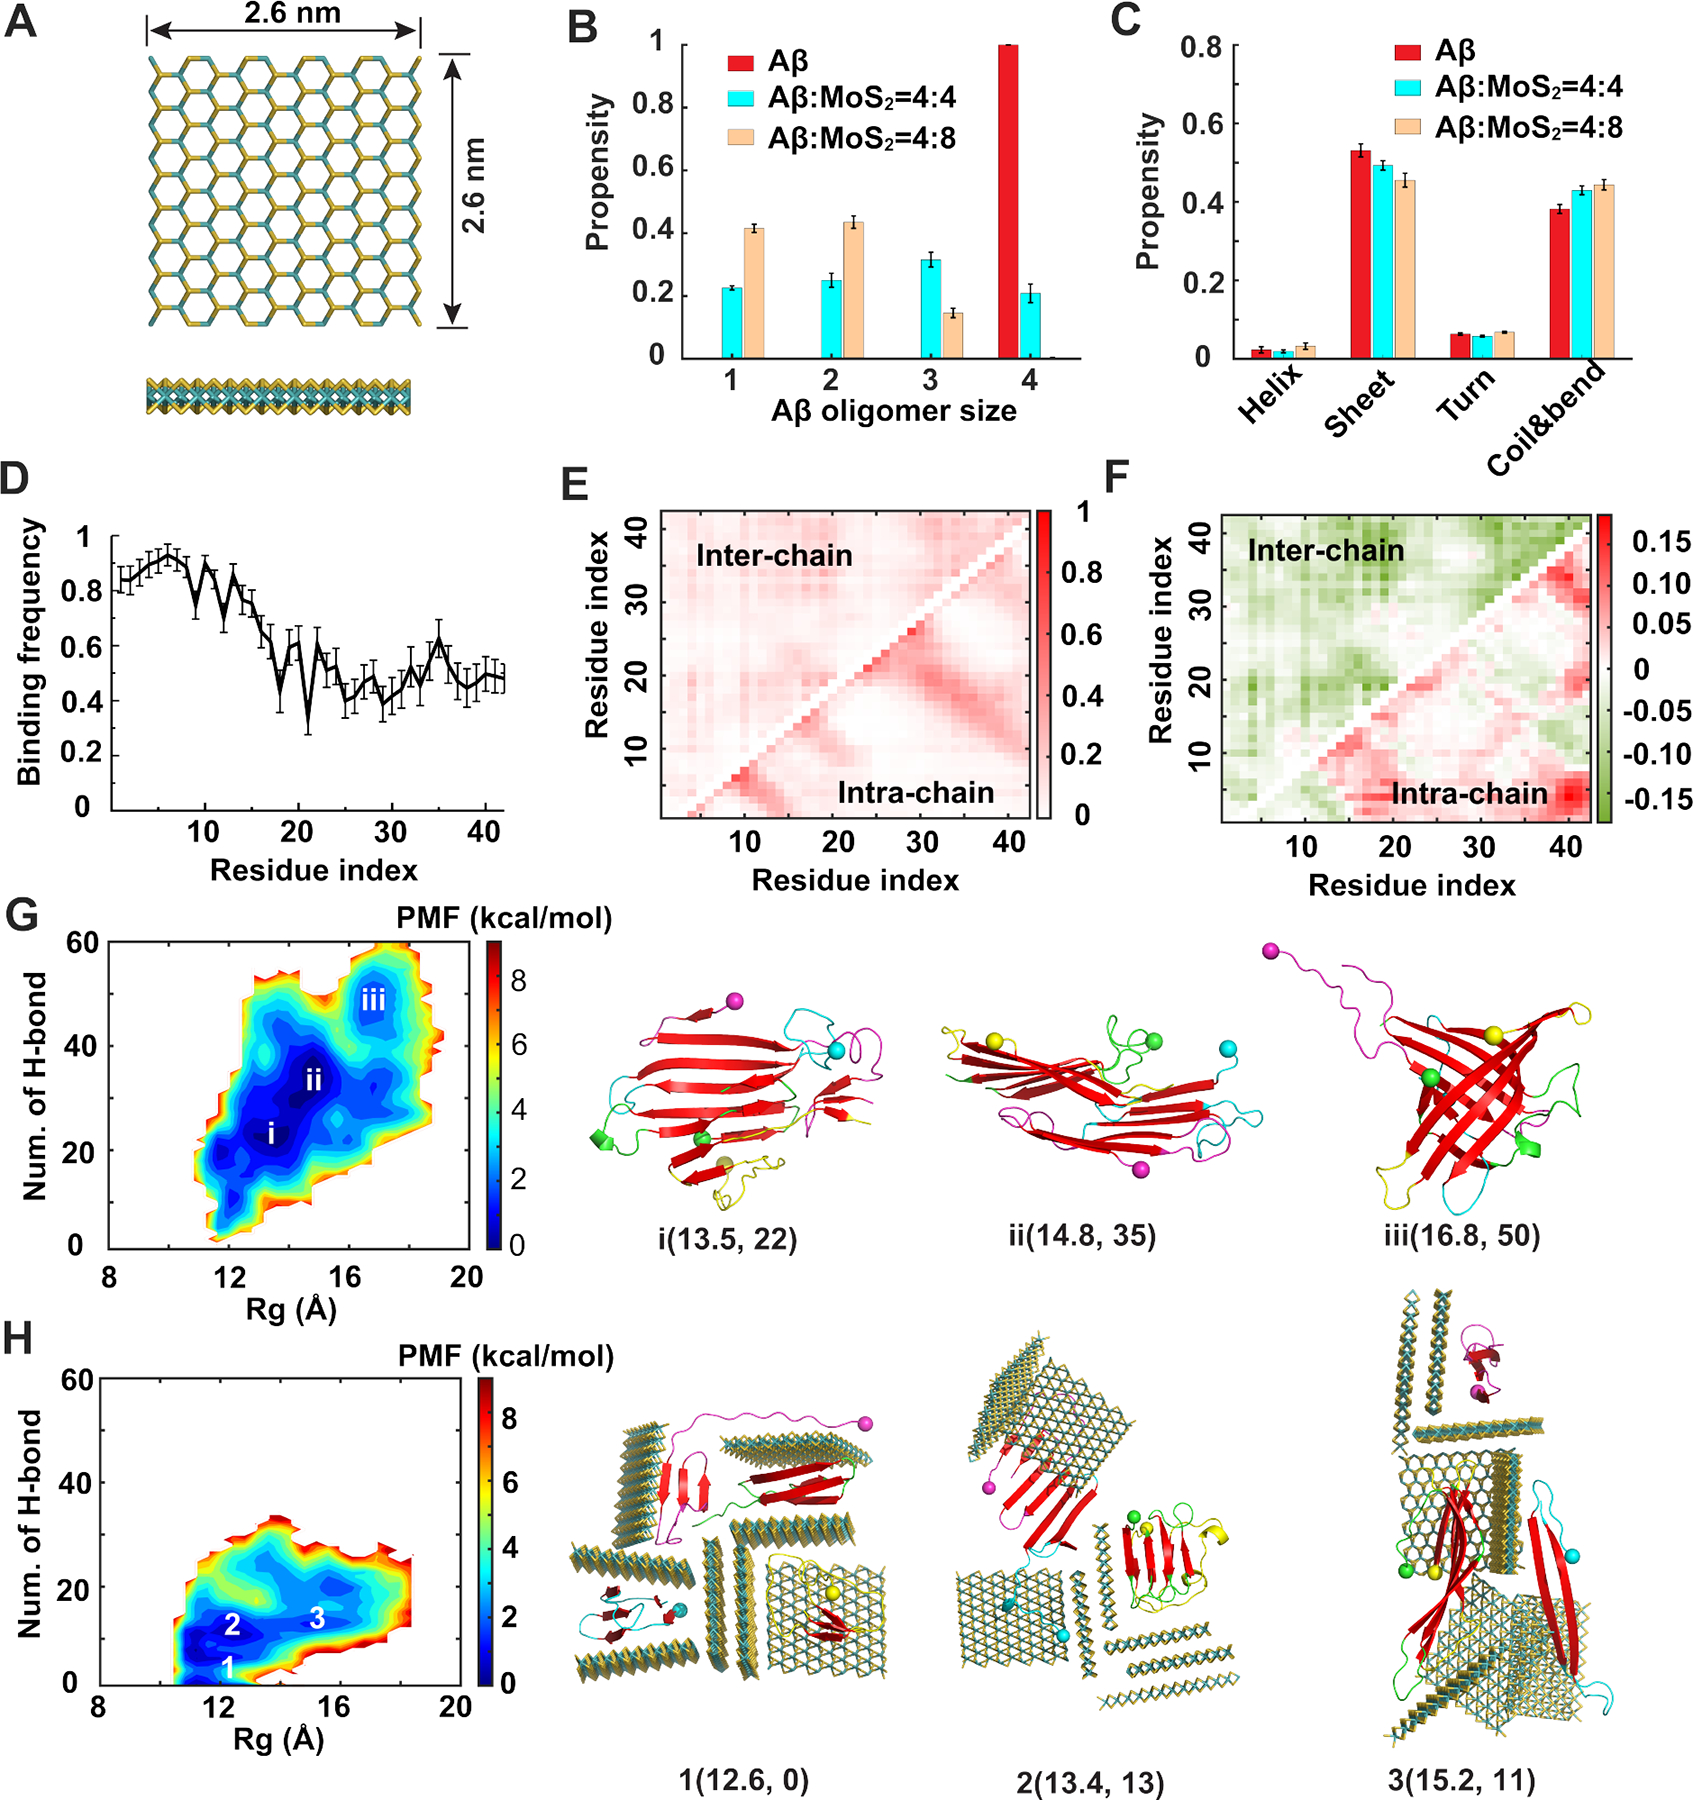
Figure 5. Coaggregation of Aβ peptides with ultrasmall MoS2 quantum dots.

(A) Atomic structure of the ultrasmall MoS2 QD used in our simulations. (B) Distribution of Aβ oligomer size in the absence and presence of ultrasmall MoS2 QDs. (C) Secondary structure propensities of Aβ after the simulations reached the steady state. (D) Binding frequency of each Aβ residue with ultrasmall MoS2 QDs. (E) Intra- and inter-peptide contact frequency maps for Aβ peptides. (F) Changes of the contact frequency maps for the system with Aβ:MoS2=4:8 compared with the control one. (G, H) Two-dimensional potential of mean force (PMF) with respect of the number of inter-peptide hydrogen bond (H-bond) and radius of gyration (Rg) for Aβ peptides (G) and Aβ:MoS2=4:8 (H). The basins of the PMF (i, ii and iii in panel G and 1, 2 and 3 in panel H) were labeled with the typical snapshots presented on the right. Ultrasmall MoS2 QDs are shown as sticks and colored by elements. Aβ peptides are shown as cartoons and colored by chains with N-termini indicated by spheres and β-sheet structures highlighted in red.
