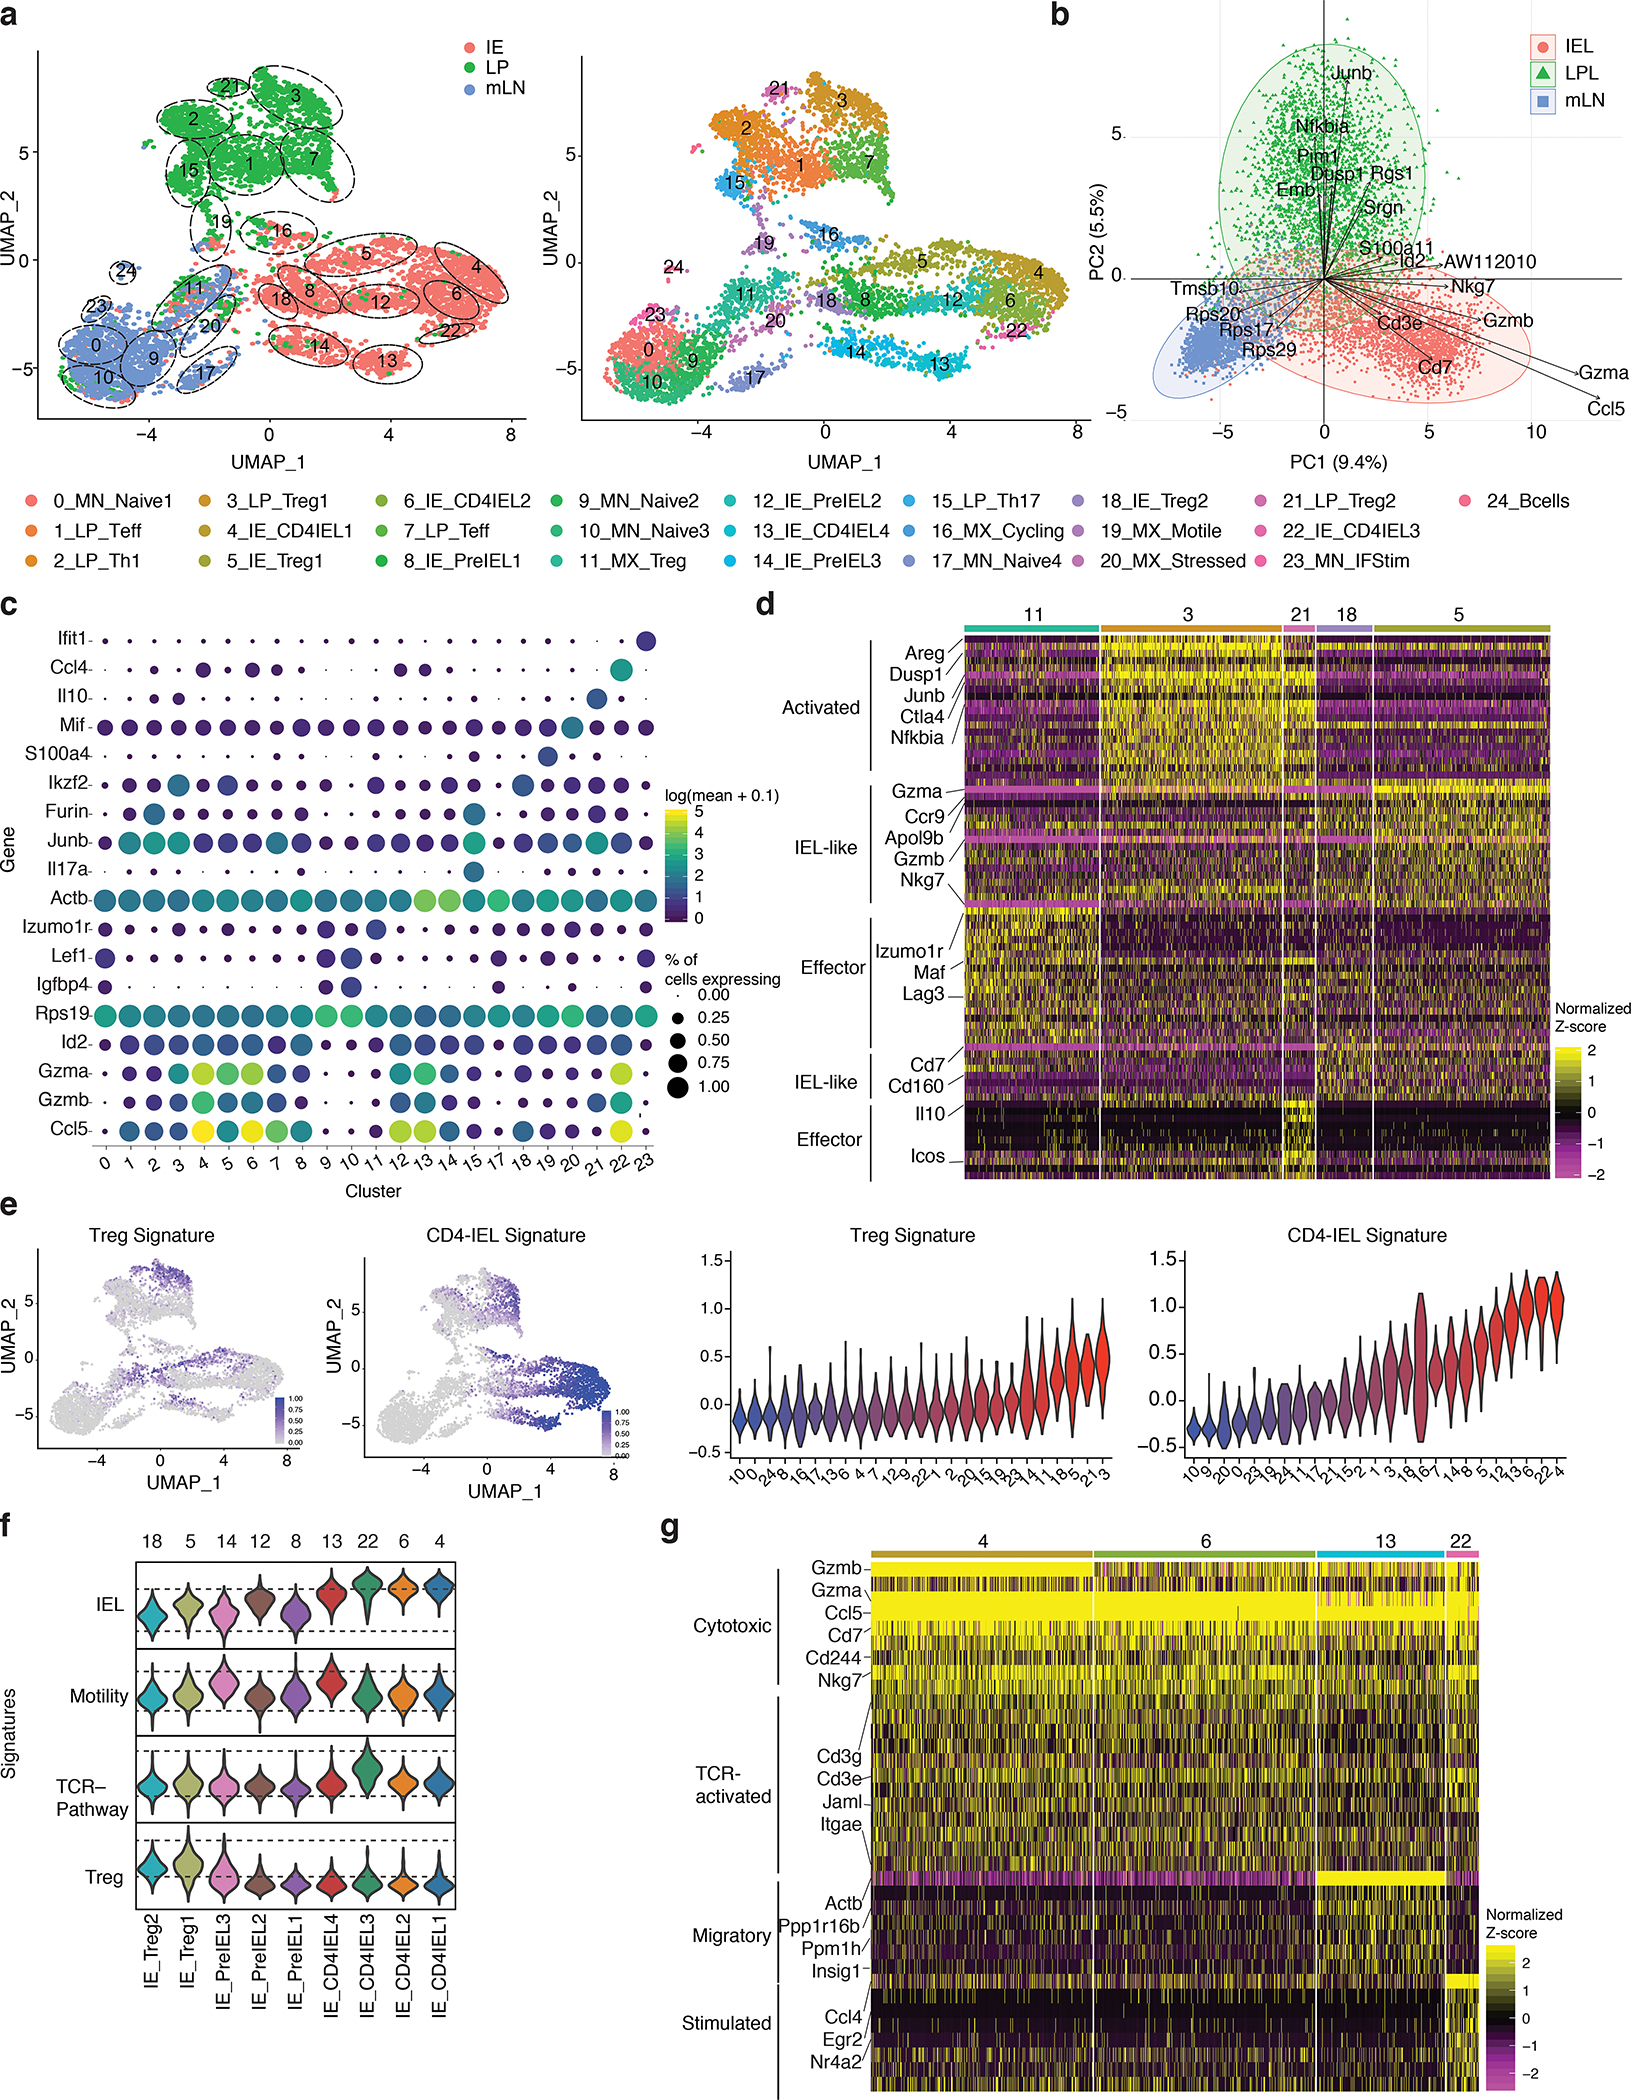
Figure 1. Intestinal epithelium imprints a cytotoxic program on migrating CD4+ T cells.

(a-g) Foxp3eGFP-Cre-ERT2xRosa26lsl-tdTomatoxZbtb7bGFP(iFoxp3TomThPOKGFP) mice were treated with tamoxifen for 10 weeks, Tomato− and Tomato+ CD4+ T cells from mesenteric lymph nodes (mLN), lamina propria (LP) and intestinal epithelium (IE) were sorted for scRNA-Seq using 10X Genomics platform from one mouse. Sorted Tomato− and Tomato+ cells were pooled in a 2:1 ratio per tissue, resulting in 3 separate libraries. (a-b) Uniform manifold approximation and projection (UMAP) representation of all sequenced cells (6,668), color coded by cluster and separated by tissue of origin (a) or mixed (b). Cluster names and numbers correspond to colors throughout the figure as indicated. (c) Principle component analysis of cells per tissue, exhibiting top 30 contributing variables variable features. (d) Heatmap of the top differentially expressed genes in Treg clusters represented by the normalized Z-score. (e) Expression levels of Treg and CD4-IEL signatures in sequenced cells (left) and quantified per cluster (right). (f) Expression levels of indicated signatures among IE clusters as indicated. (g) Heatmap of top differentially expressed genes in CD4-IEL clusters by the normalized Z-score. Significant genes were filtered based on adjusted pvalues less than 0.01 and log2fold changes higher than 0.3.
