
Figure 5: Abrogation of ThPOK in Tregs anticipates progression to IELs at the transcriptional level.
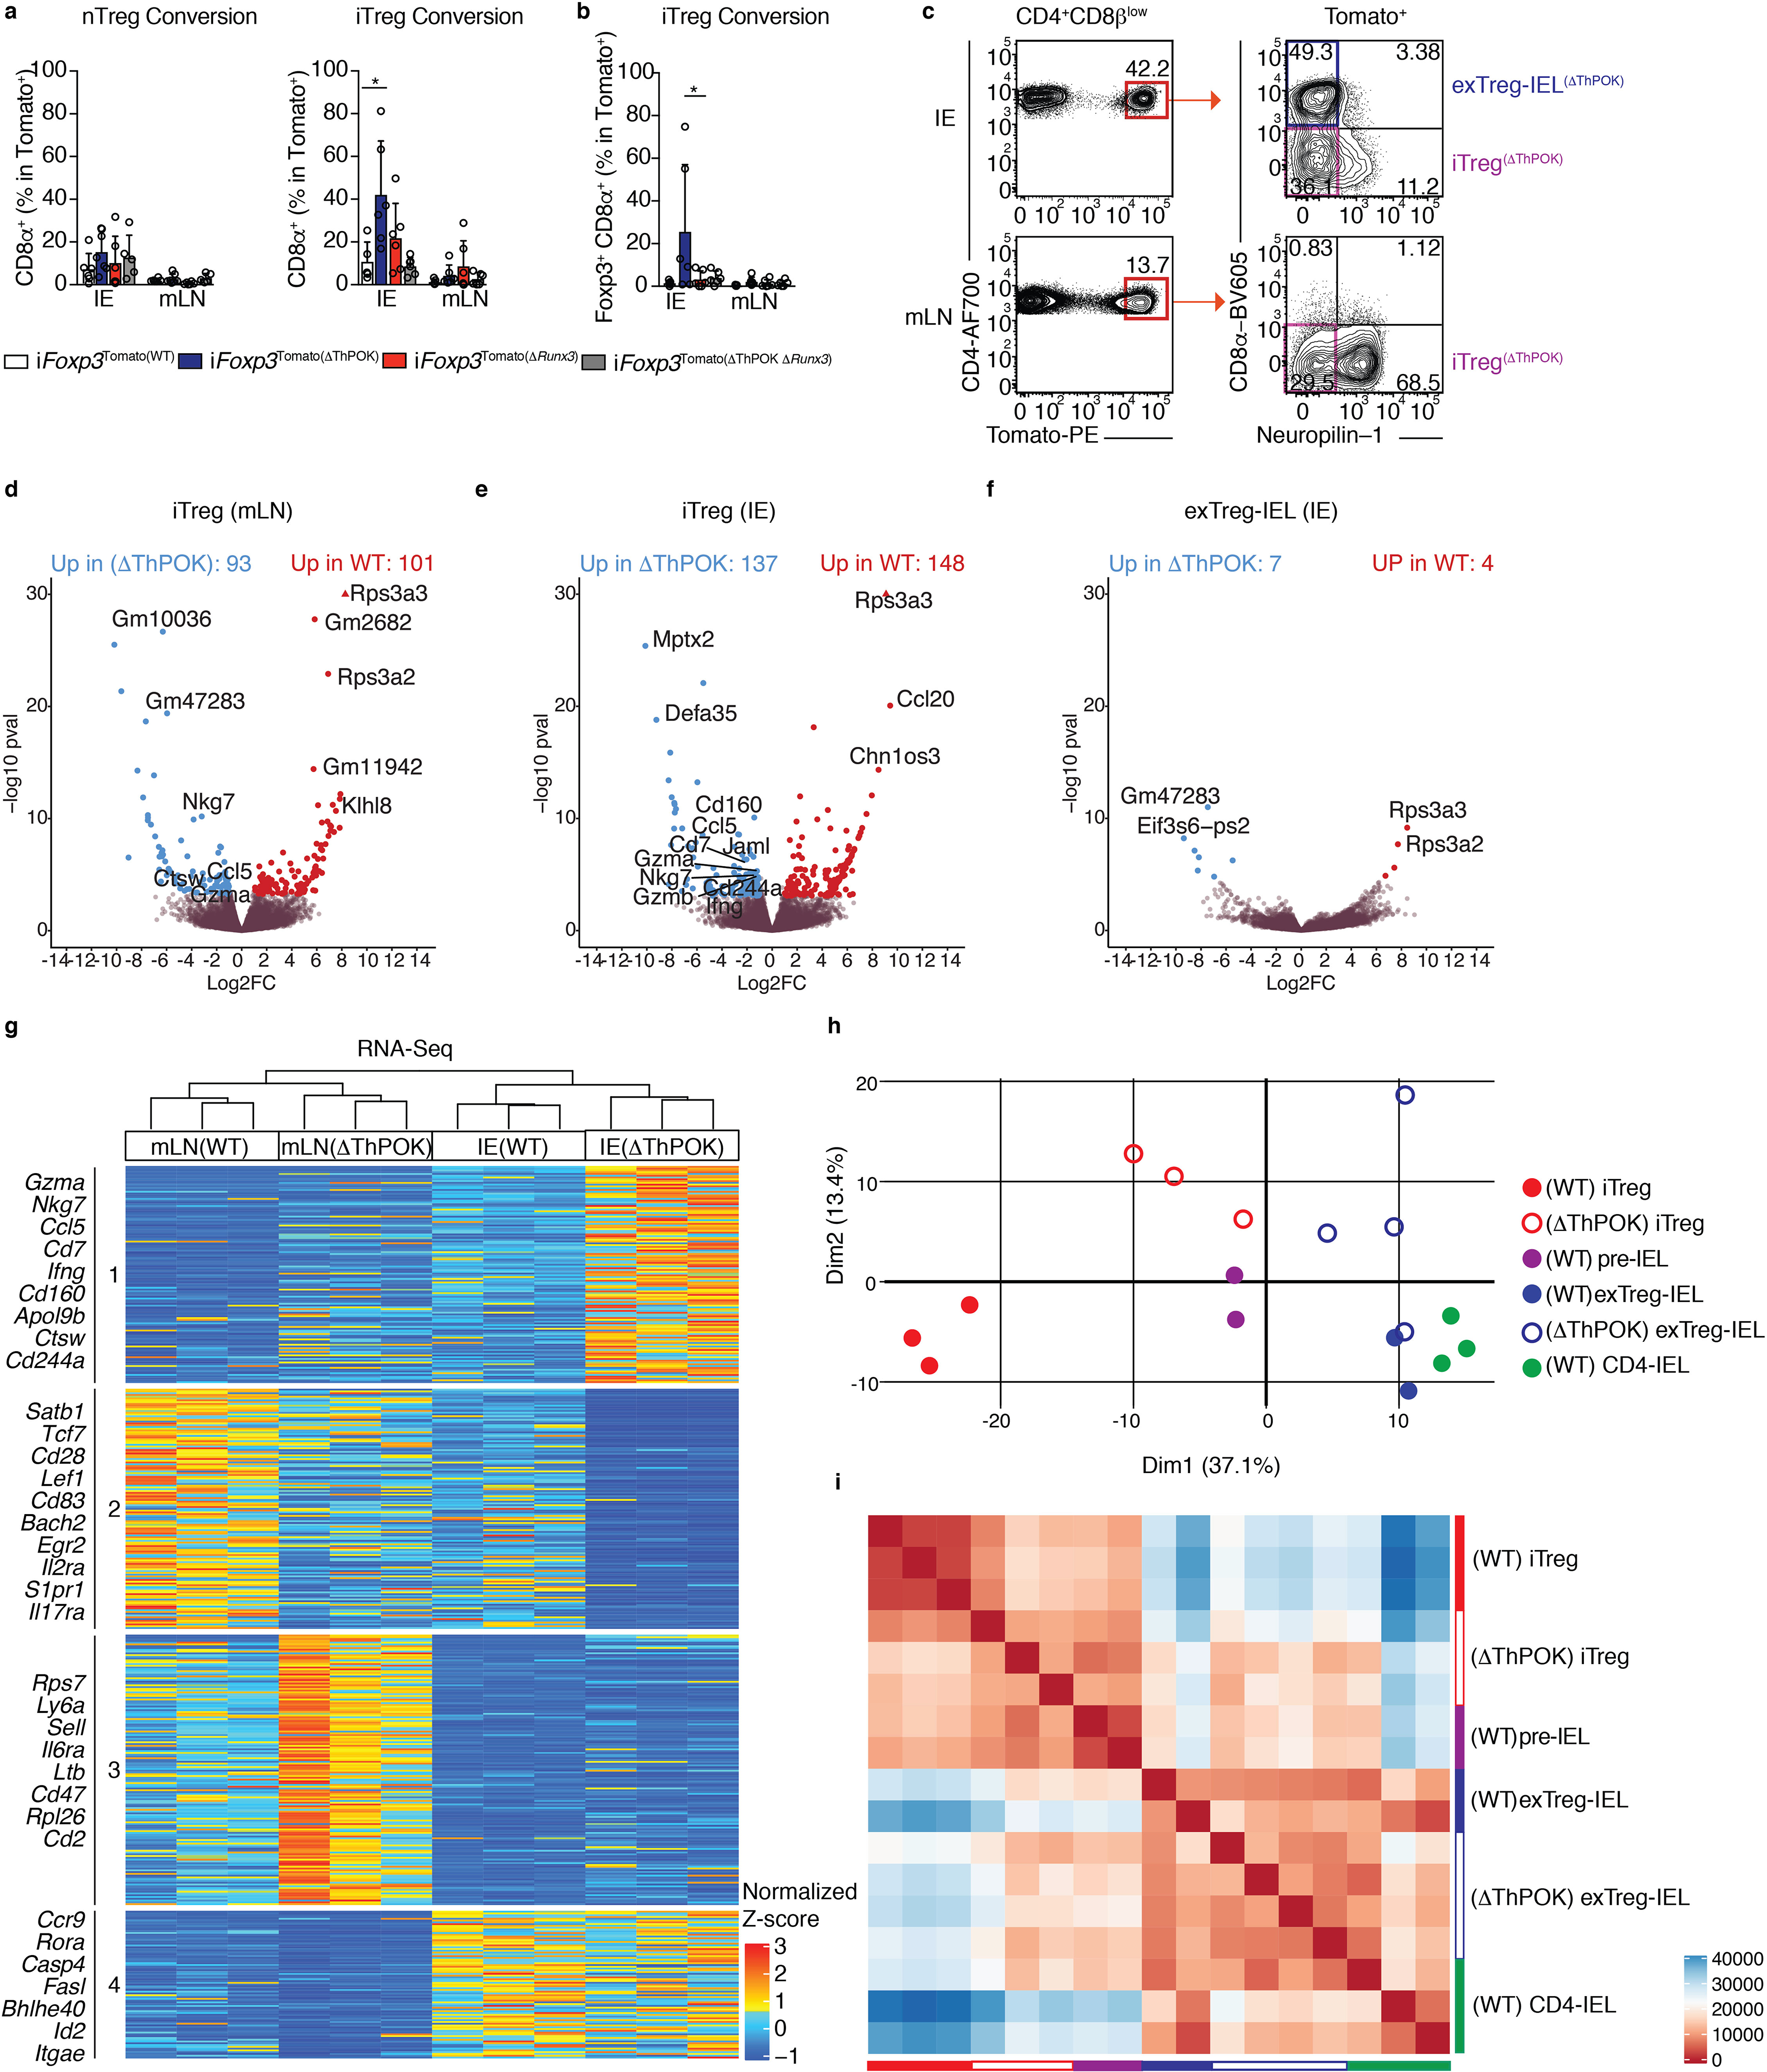
(a-b) nTreg (neuropilin-1−) or iTregs (neuropilin-1+) were sorted from spleens and mLNs of CD45.2 Zbtb7bfl/+xRunx3fl/+xRosa26|s|tdTomatoxFoxp3CreER (iFoxp3), iFoxp3xRunx3fl/+ (iFoxp3(ΔThPOK)), iFoxp3xZbtb7bfl/+xRunx3fl/fl (iFoxp3(ΔRunx3)), iFoxp3xZbtb7bfl/flxRunx3fl/fl (iFoxp3(ΔThPOK ΔRunx3)) mice after tamoxifen administration and co-transferred with CD45.1 naïve CD4+ T cells to Rag1−/− hosts. CD45.2+TCRβ+CD4+CD8β−Tomato+ lymphocytes from the IE and mLN were analyzed 10 weeks after transfer. (a) Frequencies of total surface CD8α+ cells after nTreg (left) or iTreg (right) transfer. (b) Frequency of Foxp3+CD8α+ cells after iTreg transfer. (c-i) Induced Tregs (iTregs; Tomato+CD8α−neuropilin-1−) and Treg-derived CD4-IELs (exTreg-IELs; Tomato+CD8α+) were sorted from Zbtb7bfl/flxRunx3fl/+xRosa26|s|tdTomato xFoxp3CreER (iFoxp3(ΔThPOK)) mice after 10 weeks of tamoxifen administration followed by RNA-Sequencing from IE or mLN. (c) ΔThPOK T cell populations sequenced. (d-f) Volcano representation of differentially expressed genes (DEG) between WT and ΔThPOK of the same cell type as indicated, performed by Wald pairwise comparison test, padj< 0.05. (g) Heatmap of DEGs between indicated bulk populations. Expression values represents the normalized Z-score of gene abundances (TPM). (h, i) Principle component analysis (h) and corresponding Euclidean distance analysis (i) of DEG of all WT and ΔThPOK cell types from the IE. (n=3–4 iFoxp3(ΔThPOK)). (c-i) Each sample consisted of 300–800 cells per mouse, n=2–4 mice. (a-c) Data are expressed as mean +/− SEM of individual mice (n=5–6 per genotype, 3 separate experiments). *p<0.05, **p<0.01, ***p<0.001 [one-way ANOVA and Bonferonni test].