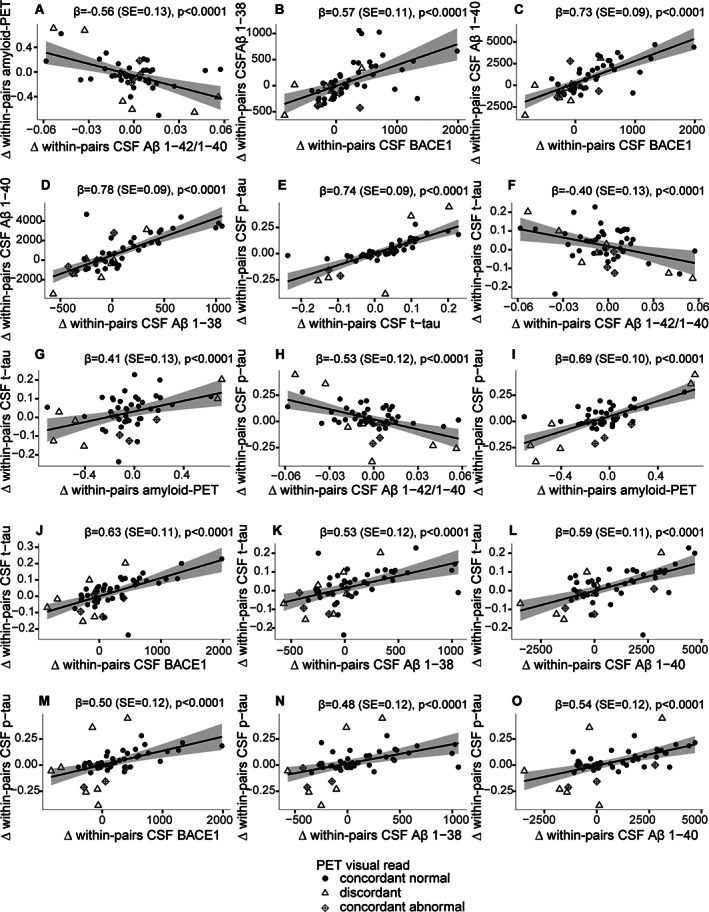
FIGURE 3.

Monozygotic within‐pair difference associations between amyloid aggregation markers, amyloid production markers, and tau. Within‐pair differences of (A) cerebrospinal fluid (CSF) amyloid‐beta (Aβ) 1–42/1–40 ratio with global cortical positron emission tomography (PET) binding (nondisplaceable binding potential [BPND]), (B) CSF beta‐secretase 1 (BACE1) with CSF Aβ1–38, (C) CSF BACE1 with CSF Aβ1–40, (D) CSF Aβ1–38 with CSF Aβ1–40, (E) CSF total‐tau (t‐tau) with CSF 181‐phosphorylated‐tau (p‐tau), (F) CSF Aβ1–42/1–40 ratio with CSF t‐tau, (G) global cortical PET binding (BPND) with CSF t‐tau, (H) CSF Aβ1–42/1–40 ratio with CSF p‐tau, (I) global cortical PET binding (BPND) with CSF p‐tau, (J) CSF BACE1 with CSF t‐tau, (K) CSF Aβ1–38 with CSF t‐tau, (L) CSF Aβ1–40 with CSF t‐tau, (M) CSF BACE1 with CSF p‐tau, (N) CSF Aβ1–38 with CSF p‐tau, (O) CSF Aβ1–40 with CSF p‐tau. Each dot represents one twin‐pair; twin‐pairs who are concordant normal on amyloid PET visual read are shown as black dots, and twin‐pairs who are concordant abnormal on amyloid PET visual read are shown as diamonds with a cross inside. Discordant pairs on amyloid PET visual read are shown as open triangles. Lower CSF Aβ1–42/1–40 ratio and higher global cortical PET binding indicate more amyloid aggregation. SE = standard error.
