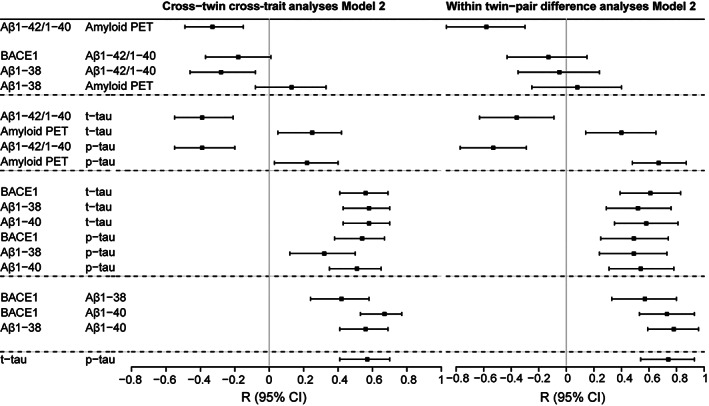
FIGURE 4.

Forest plot of cross‐twin cross‐trait and within–twin‐pair difference analyses. For cross‐twin cross‐trait analyses, data are displayed as correlation coefficient (standard error), comparable to standardized betas given in generalized estimating equations results. Calculated residuals adjusted for age, apolipoprotein E (APOE) ε4, and gender (Model 2). Correlation coefficient indicates the correlation of the production marker in one twin with the aggregation marker in their cotwin. Cross‐twin cross‐trait analyses are shown for variables that had a statistically significant association in the whole cohort (see Table 3). For within–twin‐pair difference analyses, linear regression results are shown for the relation between the standardized difference scores (z scores) within a twin‐pair per amyloid marker adjusted for age, APOE ε4, and gender (Model 2). Beta indicates the association between the within‐pair difference in the production marker and the within‐pair difference in the aggregation marker. Within‐pair difference analyses are shown for variables that had a statistically significant association in the whole cohort (see Table 3). For exact numbers, see Supplementary Table S1. Aβ = amyloid‐beta; Aβ1–38 = CSF Aβ1–38; Aβ1–40 = CSF Aβ1–40; Aβ1–42/1–40 = CSF Aβ1–42/1–40 ratio; Amyloid PET = positron emission tomography global [18F]flutemetamol binding; BACE1 = beta‐secretase 1; CI = confidence interval; CSF = cerebrospinal fluid; p‐tau = CSF 181‐phosphorylated‐tau; t‐tau = CSF total‐tau.
