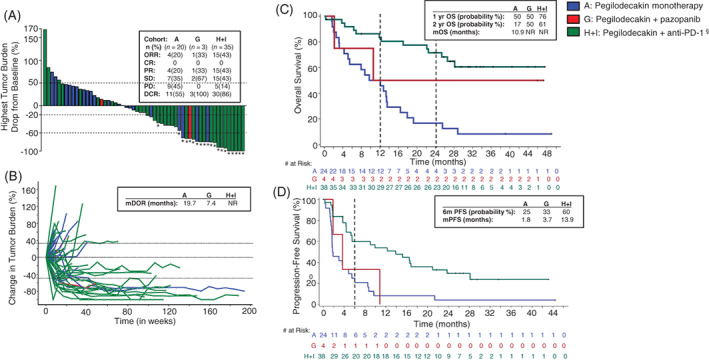
FIGURE 1.

Patient response. A, Waterfall plot depicting change in tumor burden immune‐related response criteria (irRC) from pegilodecakin monotherapy (blue bars), pegilodecakin+pazopanib (red bars) or pegilodecakin+anti‐PD‐1 (green bars) therapy in patients with renal cell carcinoma (RCC). The waterfall plot includes 57 of 58 evaluable patients. One patient from the anti‐PD‐1 cohort had only nonmeasurable lesions and could not be included in the analysis. “*” symbol indicates patients who had a partial response per tumor response assessment based on irRC. § symbol indicates anti‐PD‐1 inhibitors that include pembrolizumab and nivolumab. Best overall response per irRC is displayed in a table inset for each cohort. ORR, overall response rate; CR, complete response; DCR, disease control rate; PD, progressive disease; PR, partial response; SD, stable disease. B, Spider plot depicting change in tumor burden per irRC in pegilodecakin monotherapy (blue), pegilodecakin+anti‐PD‐1 (green) and pegilodecakin+pazopanib (red) cohorts in patients with RCC. Median duration of response (mDOR) in months is displayed in table inset for all cohorts. NR, not reached. C, Kaplan‐Meier plot of overall survival for pegilodecakin monotherapy (blue), pegilodecakin+anti‐PD‐1 (green)and pegilodecakin+pazopanib (red) in all evaluable patients with RCC. Number of patients at risk over time is displayed below the plot. Table inset displays 1‐year, 2‐year and median overall survival probabilities. NR, not reached. D, Kaplan‐Meier plot of progression‐free survival for pegilodecakin monotherapy (blue), pegilodecakin+anti‐PD‐1 (green) and pegilodecakin+pazopanib (red) in all evaluable patients with RCC. Number of patients at risk over time is displayed below the plot. Table inset displays median PFS (mPFS) and 6‐month probability
