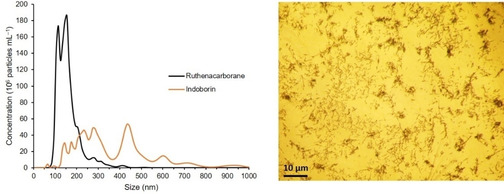
Figure 3.

Left: Size distribution of self‐assembled nanoparticles of closo‐[3‐(η6‐p‐cymene)‐1,2‐Me2‐3,1,2‐RuC2B9H9] (denoted Ruthenacarborane) [48] and 1‐(1‐carboxy‐1,2‐dicarba‐closo‐dodecaboranyl)‐5‐methoxy‐2‐methyl‐1H‐indole‐3‐acetic acid methyl ester (denoted Indoborin), [49] in PBS/DMSO mixture, from NTA. Concentration for both compounds: 20 μM. DMSO content: 1.0 vol %, T=25 °C. Average data from five replicates are shown. Standard deviations are for a given concentration in the range of ±3.3–8.9×10⁷ particles mL−1 and for a given size in the range of 2.4–26.9 nm. Right: Inverted‐light microscope image (40× optical zoom) of MCF‐7 cells, after 72 h of incubation with the ruthenacarborane derivative (30 μM). Dark spots are “big” agglomerates (i. e., precipitated aggregates) of the ruthenacarborane derivative. Experimental details of the NTA measurements and the cell culture experiment are given in ref. [53]; NTA measurements for indoborin are unpublished data (experimental details analogous to ref. [53]).
