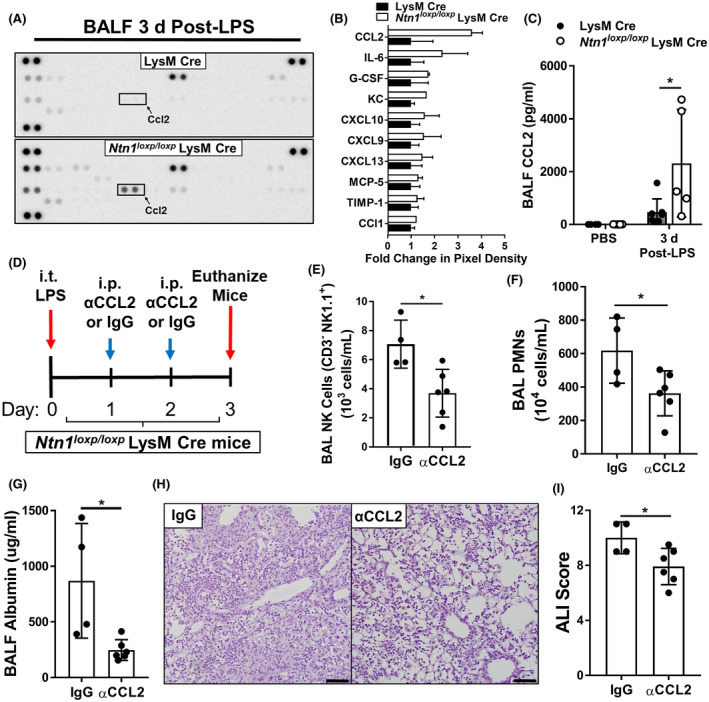
FIGURE 6.

C‐C motif chemokine ligand 2 (CCL2) neutralization in Ntn1loxp/loxp LysM Cre mice reduces natural killer (NK) cell infiltration in the airway and improves LPS‐induced lung injury. Using Bronchoalveolar lavage fluid (BALF) collected from LysM Cre and Ntn1loxp/loxp LysM Cre mice 3 days after onset of LPS‐induced lung injury, we performed a membrane‐based sandwich immunoassay to profile for changes in inflammatory cytokines and chemokines. A, Representative dot‐blot of the membrane‐based immunoassay. B, Quantified pixel density of the top 10 upregulated cytokines/chemokines in Ntn1loxp/loxp LysM Cre mice relative to LysM Cre controls (n = 2 per group). C, CCL2 upregulation was confirmed in BALF of Ntn1loxp/loxp LysM Cre mice relative to LysM Cre mice 3 days after onset of LPS‐induced lung injury using enzyme‐linked immunosorbent assay (ELISA) (n = 4‐7 mice per group, Bonferroni‐adjusted unpaired t test). D, Experimental scheme: Ntn1loxp/loxp LysM Cre were given LPS‐induced lung injury and then, subsequently given intraperitoneal (i.p.) injections of neutralizing CCL2 antibodies (αCCL2) or IgG isotype control (10 μg/g of body weight) on days 1 and 2 after the onset of lung inflammation. Mice were subsequently euthanized for analysis on day 3 after the onset of lung inflammation. E, Quantification of total NK cells (CD3‐ NK1.1+) in the BAL collected from αCCL2‐treated Ntn1loxp/loxp LysM Cre mice 3 days after onset of LPS‐induced inflammation was measured by flow cytometry (n = 4‐6 mice per group, unpaired t test). F, Quantification of total polymorphonuclear neutrophils (PMNs) in the BAL collected from αCCL2‐treated Ntn1loxp/loxp LysM Cre mice 3 days after onset of LPS‐induced lung injury (n = 4‐6 mice per group, unpaired t test). G, Pulmonary edema was assessed by enzyme‐linked immunosorbent assay (ELISA) quantification of bronchoalveolar lavage fluid (BALF) albumin in αCCL2‐treated Ntn1loxp/loxp LysM Cre mice (n = 4‐6 mice per group, Mann‐Whitney test). H and I, Representative hematoxylin and eosin staining and lung pathology scoring of lung sections from αCCL2‐treated Ntn1loxp/loxp LysM Cre mice (n = 4‐6 mice per group, unpaired t test). All data are represented as mean ± SD; *P‐value < .05
