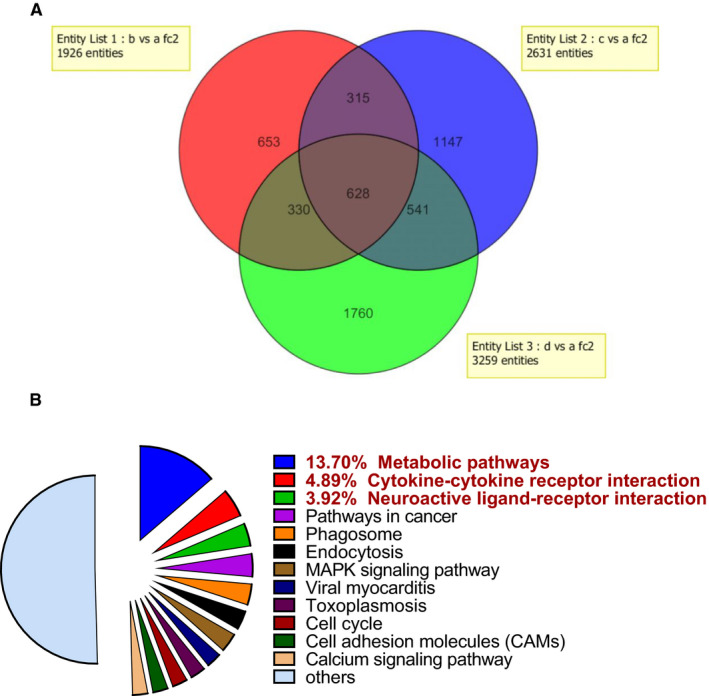
FIGURE 3.

Comparison of hepatic differential gene expression by gene chip analysis. (A) Venn diagram of differentially expressed genes in the liver of HFC57 mice across the three treated groups with either 100 mg/kg metformin alone (Met, Red part, b), 20 mg/kg BFOV alone (BFOV, Blue part, c), or 100 mg/kg metformin and 20 mg/kg BFOV in combination (BFOV + Met, Green part, d). Transcript detection was selected for differential expression of ≥ 5‐folds relative to the Con group (a). (B) Pie charts of the functional classes of differentially expressed transcripts from BFOV + Met group. Transcript detection was selected for differential gene expression of ≥ 5‐folds relative to the Con group. Differentially expressed genes belonging to various functional categories were annotated from the KEGG pathways
