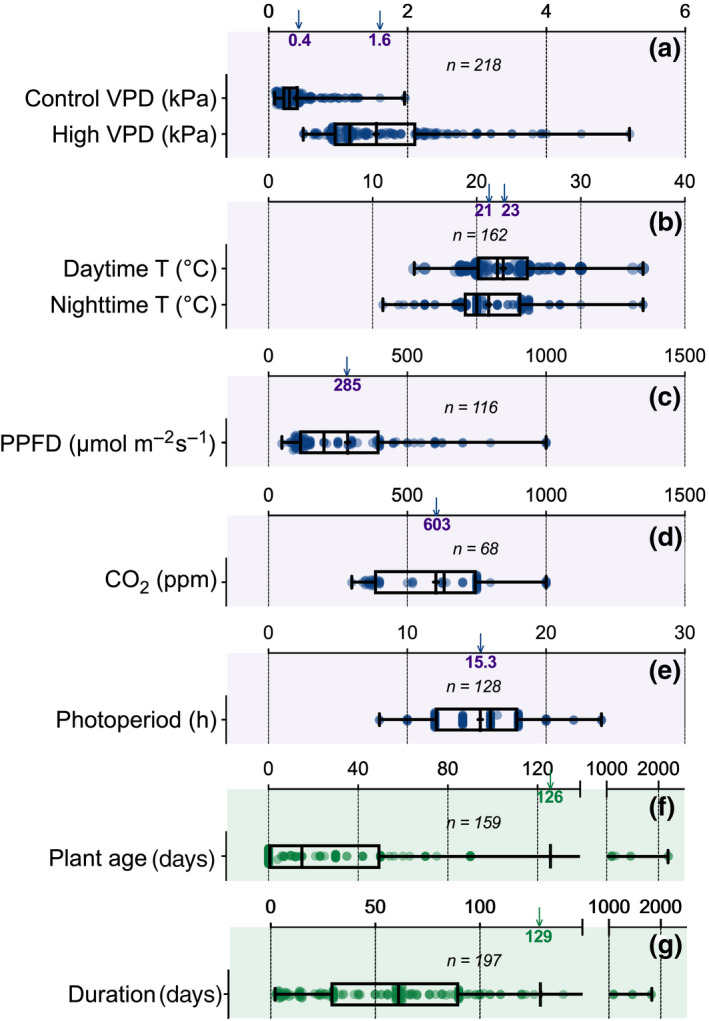
FIGURE 2.

Ranges of average environmental conditions (a–e), plant age when the experiment was initiated (f), and treatment duration (g) for all studies considered in the meta‐analysis. In each panel, n represents the number of studies. Box and whiskers and scatter plots represent the range of each environmental variable. In the box and whiskers, the box represents the median and the 25th–75th percentiles while the whiskers indicate minimal and maximal values. The “+” sign represents the mean value for the considered variable. In each panel, this mean value is reported on the x‐axis by the vertical arrow and the number at the bottom of the arrowhead. PPFD, photosynthetic photon flux density; T, temperature; VPD, vapor pressure deficit
