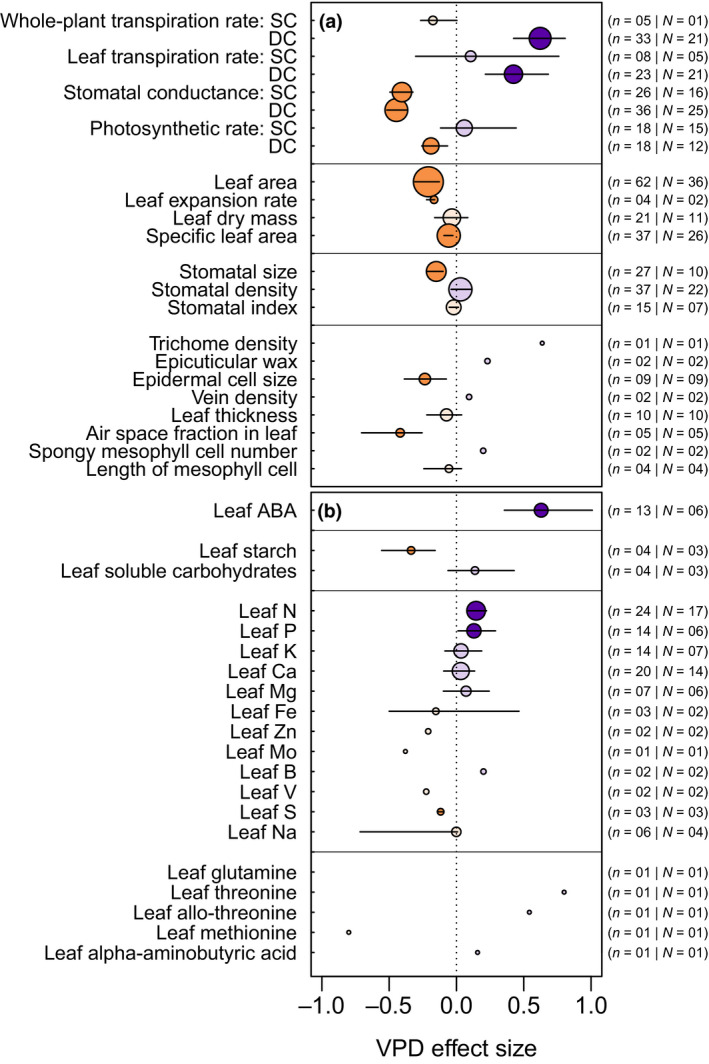
FIGURE 3.

Vapor pressure deficit (VPD) effect size for leaf gas exchange, development, and anatomy (a), and leaf biochemical status (b). Horizontal lines represent 95% confidence intervals (CI). Because these are bias‐corrected bootstrap intervals, the intervals are on occasion not centered around the estimated value. CI lines are not drawn when the number of studies is lower than 3. Purple and orange colors reflect VPD effect size values higher or lower than zero, respectively. Traits and physiological variables with 95% CI not intersecting with zero are highlighted with darker shades. The numbers reported on the right‐hand side, that is, n and N, represent the total number of studies and number of species used, respectively. In panel (a), the abbreviations SC and DC represent conditions during gas exchange measurements (SC, same condition; DC, different conditions; see Section 2 for details). Data for traits and physiological variables with an effect size over 1 or under −1 are omitted to maximize comparability. This is the case for glutamine (n = 1, effect size = 1.97). ABA, abscisic acid; B, boron; Ca, calcium; Fe, iron; K, potassium; Mg, magnesium; Mo, molybdenum; N, nitrogen; P, phosphorus; S, sulfur; V, vanadium; Zn, zinc. See Table 1 for trait descriptions
