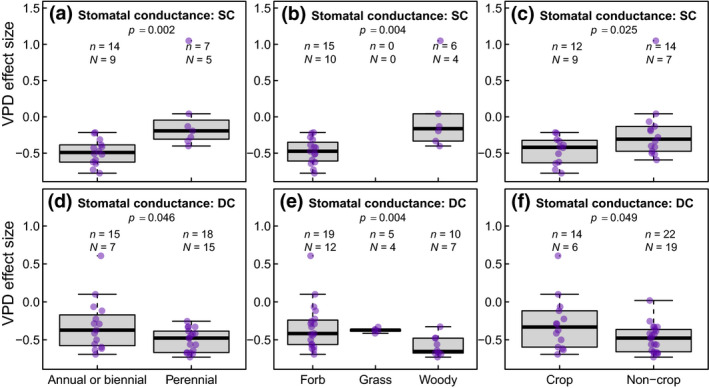
FIGURE 6.

Significant differences in vapor pressure deficit (VPD) effect size as a function of plant functional types for stomatal conductance measured under same or different cuvette conditions (SC and DC, respectively). Individual datapoints are plotted along the box and whiskers to enable visualization of outliers. The thick line in the center of each box and whisker represents the median, while the box represents the interquartile range (IQR, i.e., the 25th–75th percentile), with the whiskers extending to values that are 1.5 times the value of IQR. Letters N and n refer to the numbers of species and studies, respectively
