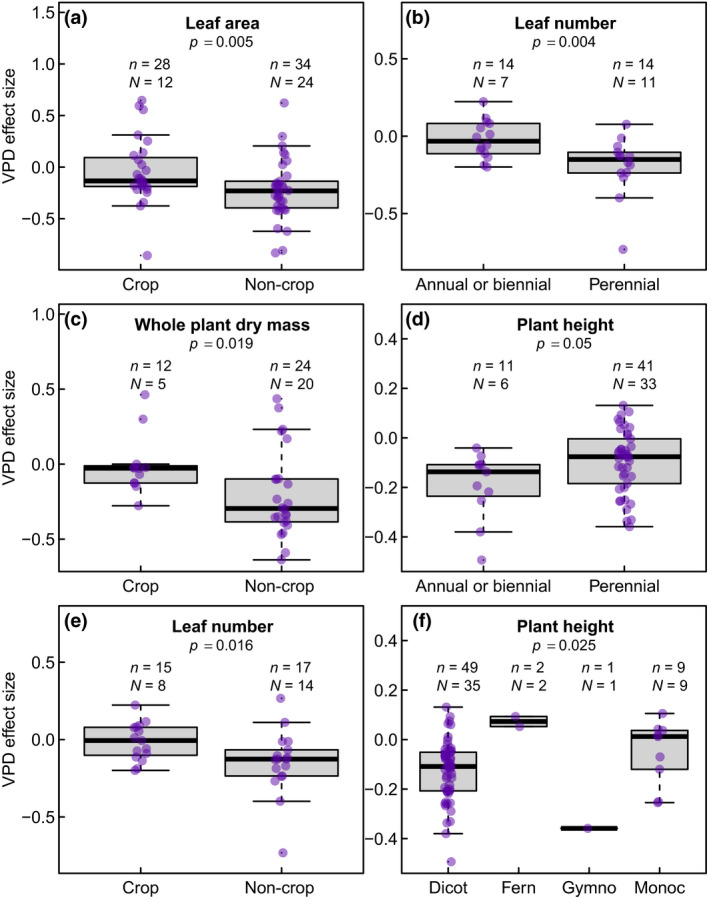
FIGURE 7.

Plant traits (a–f) exhibiting significant (p < 0.05) or near‐significant variation (p = 0.05) in vapor pressure deficit (VPD) effect size as a function of plant functional types. The other attributes of the figure are as described in the caption of Figure 6
