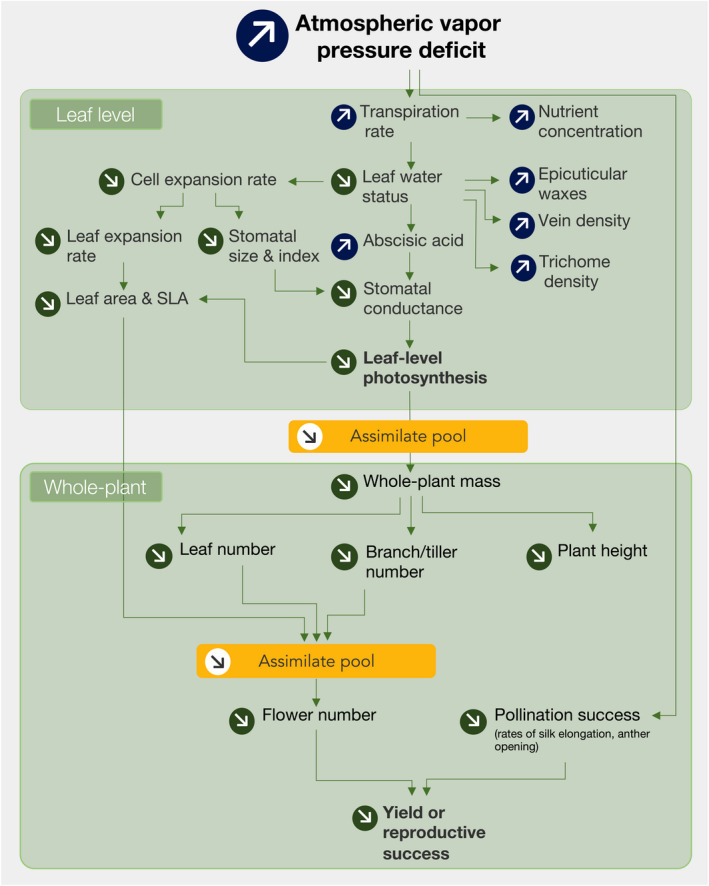
FIGURE 8.

A general framework synthesizing the integrated effects of atmospheric vapor pressure deficit (VPD) increase on plant productivity and yield, based on the meta‐analysis. Arrows in circles represent the direction of change in the trait (increase or decrease) as a result of increased VPD. The two main organizational scales (leaf and whole‐plant) are separated in two green boxes for clarity. Green arrows depict relationships between traits within and across organizational scales, which were identified based on the literature review. Orange boxes refer to leaf‐level and whole‐plant‐level photoassimilate (carbon‐based) pools. Abbreviations are explained in Table 1
