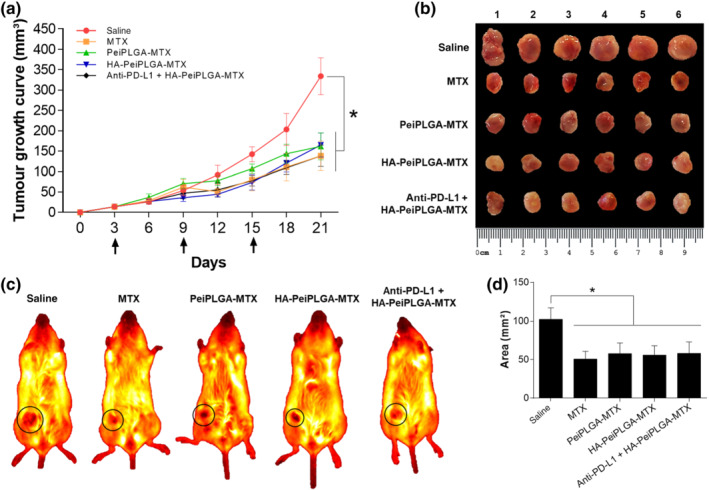
FIGURE 6.

Inhibition of tumour growth. The growth curve of orthotopic breast tumours in BALB/c mice shows a reduction in tumour volumes after treatment with naked and HA‐coated MTX‐loaded PLGA NPs, as well as with free MTX (a). Arrows indicate therapeutic interventions via peritumour administration. The excised tumours were presented on a panel for comparative analysis of tumour size (b). The exact growth area location of orthotopic tumours in mice is illustrated with black circles (c). From these images, the areas occupied by tumours were measured for graphical representation in mm2 (d). All data are presented as mean ± SD of n = 6 per group, * P < .05, significantly different as indicated; one‐way ANOVA with post hoc Bonferroni correction or Kruskal–Wallis with post hoc Dunn correction
