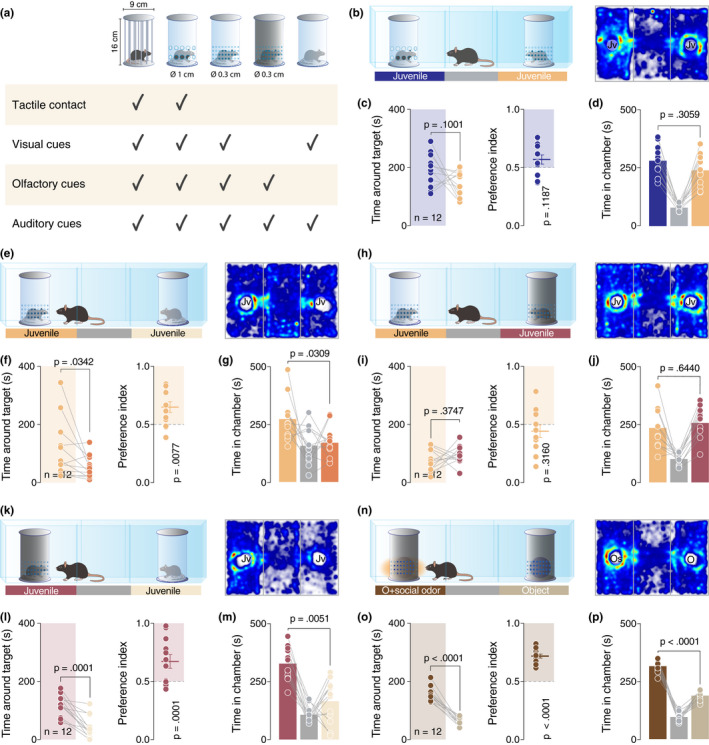
FIGURE 2.

Social odors are sufficient to develop the preference. (a) Schematic representation of the type of enclosures used in this study. (b, e, h, k and n) Left: schematic representation of the three‐chamber test. Right: heatmap reporting the mean occupancy of the batch of mice during the test. (c, f, i, l and o) Left: time around the enclosures containing the stimuli (paired t‐test. c: t 11 = 1.795, p = .1001. f: p = .0342 (Wilcoxon matched‐pairs signed rank test). i: t 11 = 0.9252, p = .3747. l: t 11 = 5.736, p = .0001. o: t 11 = 10.82, p < .0001). Right: calculated preference index (one‐sample t‐test against theoretical mean = 0.5. c: t 11 = 1.692, p = .1187. f: t 11 = 3.255, p = .0077. i: t 11 = 1.05, p = .3160. l: t 11 = 5.786, p = .0001. o: t 11 = 13.09, p < .0001). (d, g, j, m and p) Time spent in each chamber (paired t‐test. d: t 11 = 1.074, p = .3059. g: t 11 = 2.473, p = .0309. j: t 11 = 0.4751, p = .6440. M: t 11 = 3.482, p = .0051. P: t 11 = 9.921, p < .0001). Jv, juvenile conspecific; O, object; Os = object impregnated with social odors and n = number of mice that performed the experiment
