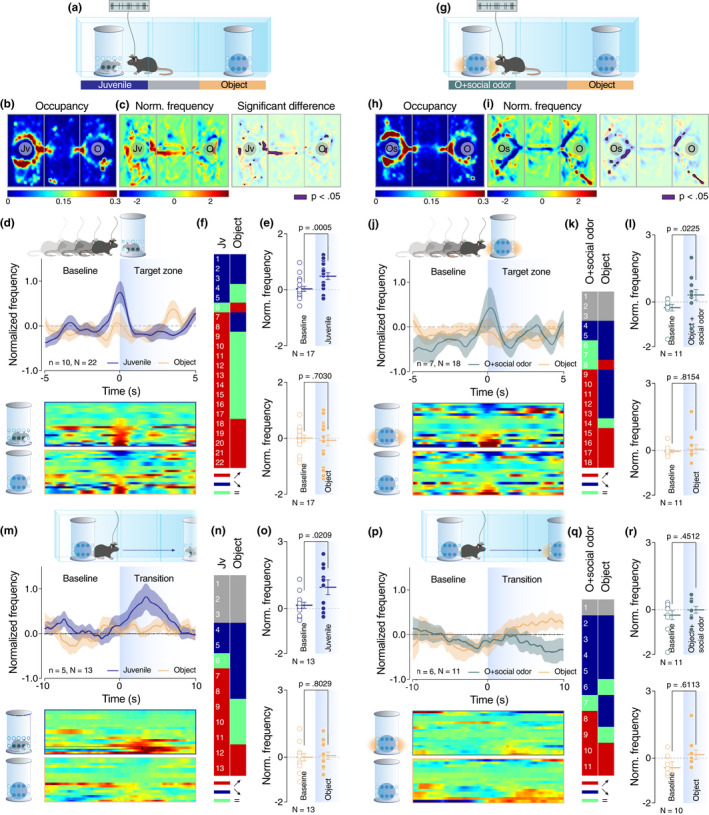
FIGURE 3.

VTA dopaminergic neurons behave differently according to the perception of sensory cues. (a and g) Schematic representation of the three‐chamber test. (b and h) Heatmap reporting the mean occupancy of the batch of mice during the test. (c and i) Left: heatmap reporting the normalized VTA pDA activity regarding the occupancy of the batch of mice during the test. Right: same heatmap overlaid by the occupancy with a significant difference of VTA‐pDA activity compared to overall activity (p < .05). (d, j, m, and p) Top: schematic representation of the behavior analyzed (enter of experimental mice in the proximity of the enclosure (target zone) for d and j; initiation of the transition from one chamber to the opposite one for m and p). Middle: PETH of normalized VTA pDA activity centered on the behavior described above. Down: a heatmap of the corresponding PETH of normalized VTA pDA activity for each neuron recorded. (e, k, n and q) Table of activity response of individual VTA pDA neurons for each event and stimuli (red, positive response; blue, negative response; green, no response for given stimuli; grey, no response for any stimuli). (f and l) Comparison of normalized VTA DA activity for positive responding neurons between baseline and the enter in the target zone (f top: paired t‐test (t 16 = 4.311); f down: paired t‐test (t 16 = 0.3882); l top: Wilcoxon test (W = 50); l down: Wilcoxon test (W = −6)). (o and r) Comparison of normalized VTA DA activity for positive responding neurons between baseline and direct transition (o top: paired t‐test (t 12 = 2.656); o down: paired t‐test (t 12 = 0.2552); r top: Wilcoxon test (W = 18); r down: Wilcoxon test (W = 11). Jv = juvenile conspecific, O = object, n = number of mice that performed the experiment, and N = number of neurons recorded during the experiment
