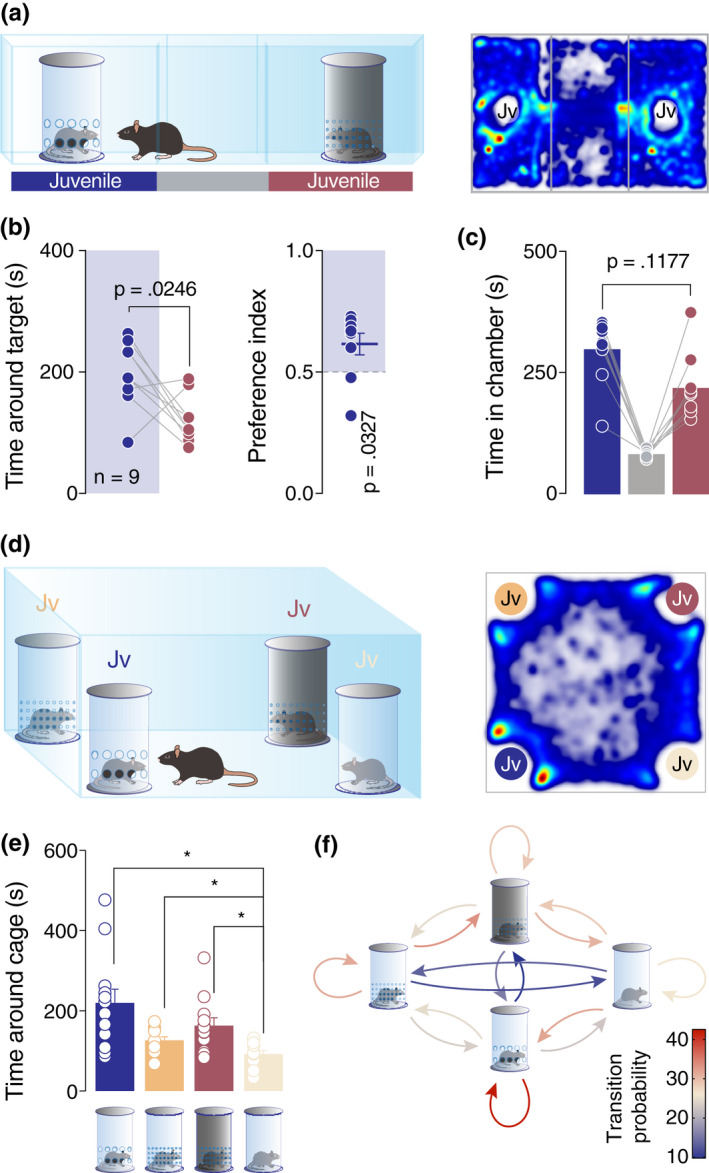
FIGURE 4.

Mice prefer to explore complex stimuli which influence multi‐sensory modalities. (a) Left: schematic representation of the three‐chamber test. Right: heatmap reporting the mean occupancy of the batch of mice during the test. (b) Left: time around the enclosures containing the stimuli (paired t‐test. t 8 = 2.762, p = .0246). Right: calculated preference index (one‐sample t‐test against theoretical mean = 0.5. t 8 = 2.579, p = .0327). (c) Time spent in each chamber (paired t‐test. t 8 = 1.753, p = .1177). (d) Left: schematic representation of the Four‐choices test. Right: heatmap reporting the mean occupancy of the batch of mice during the test. (e) Time around the enclosures containing the stimuli (RM one‐way ANOVA: F 1.436,15.8 = 6.906, p = .0116, followed by Bonferroni's multiple comparison post hoc test). (f) A diagram representing a two‐state Markov process. The heatmaps report the probability of the Markov process changing from one state to another state, with the direction indicated by the arrow. Jv, juvenile conspecific and n, number of mice that performed the experiment
