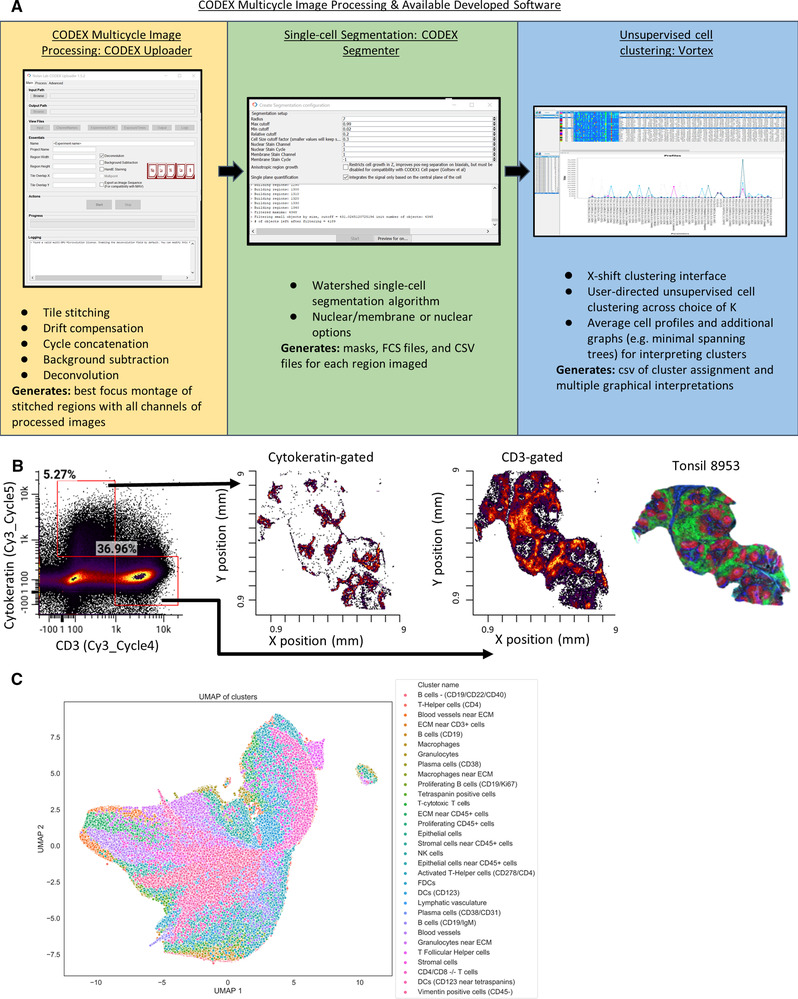
Figure 4.

Processing of CODEX multiparameter imaging data. (A) The image analysis was performed using our “CODEX Uploader” for image processing, “CODEX segmenter” for cell segmentation, and “VORTEX” for unsupervised single‐cell clustering. (B) Example of segmented data from tonsil 8953 as an fcs file with populations gated on fluorescent intensity of CD3 or Cytokeratin (no prior gating). These gated CD3+ and Cytokeratin+ populations are plotted with × (mm), y (mm) coordinates to reveal spatial locations of the populations in the tissue. (C) UMAP plot of all data with the 31 cell types identified by unsupervised clustering indicated by color (total number of cells quantified from single‐cell segmentation from all tissues imaged = 2.3 × 10⁶ cells).
